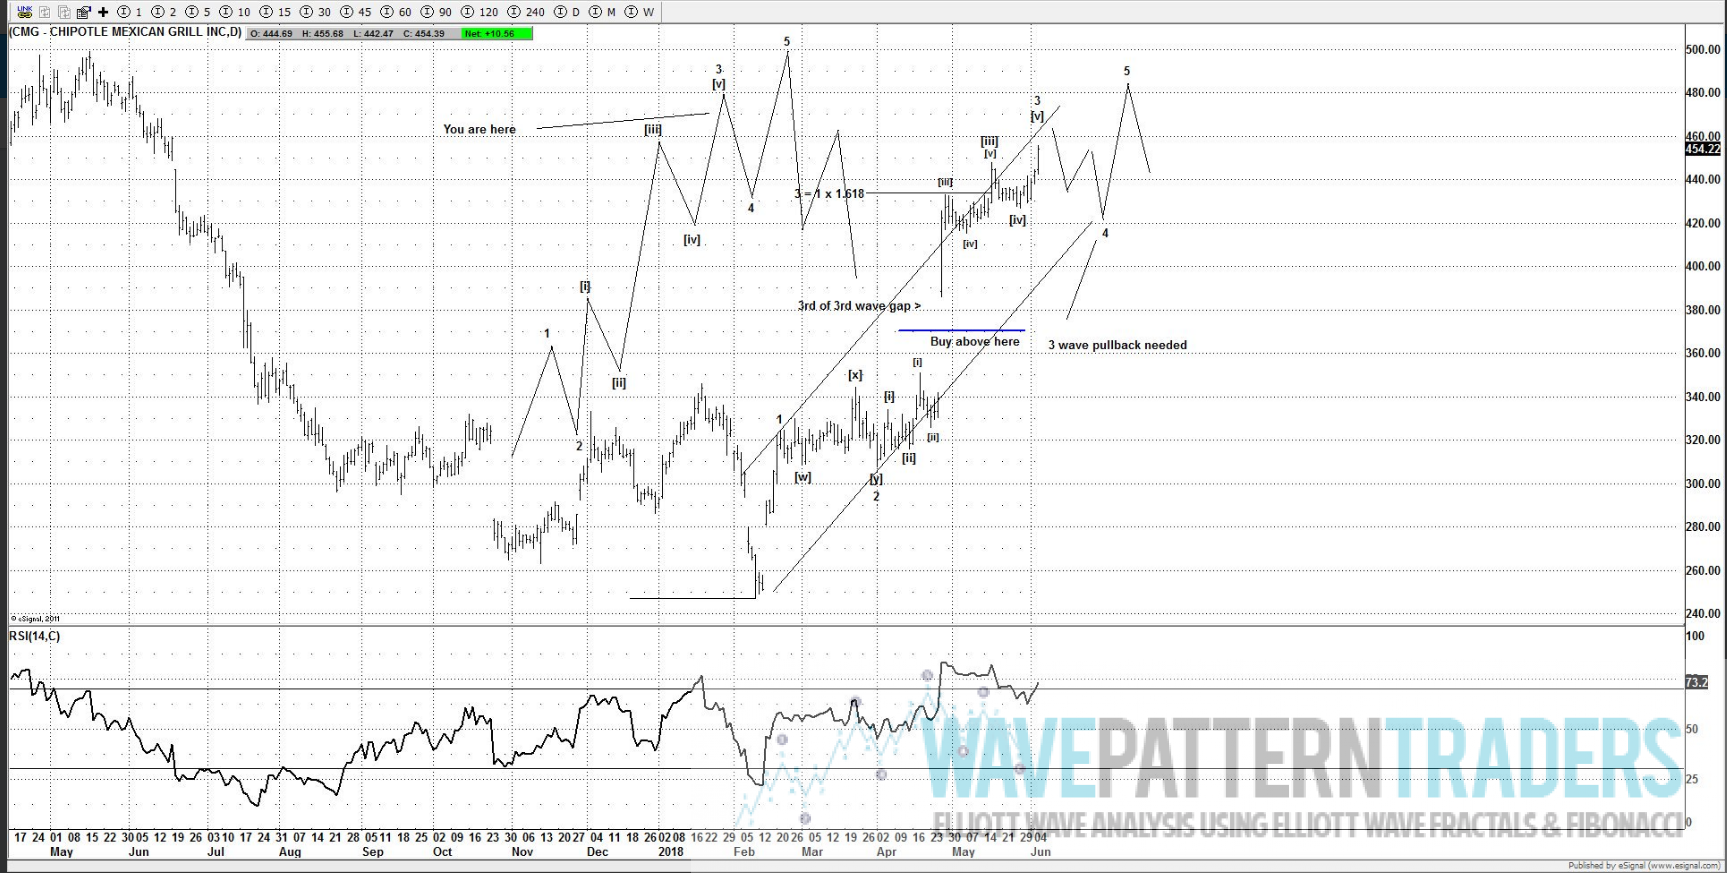
The upside above 460.00 is further supporting the idea of a move to new highs for wave 5 and complete an impulse wave from the Feb 2017 lows, barring a more complex pattern such as a triangle for wave 4, then continue to target new highs above the Jun highs. There is a measured move target near the 492.00 area that can act as resistance and suggest sellers arrive, but any new high above the wave 3 highs (Jun highs) would be enough to suggest wave 5 is completed.
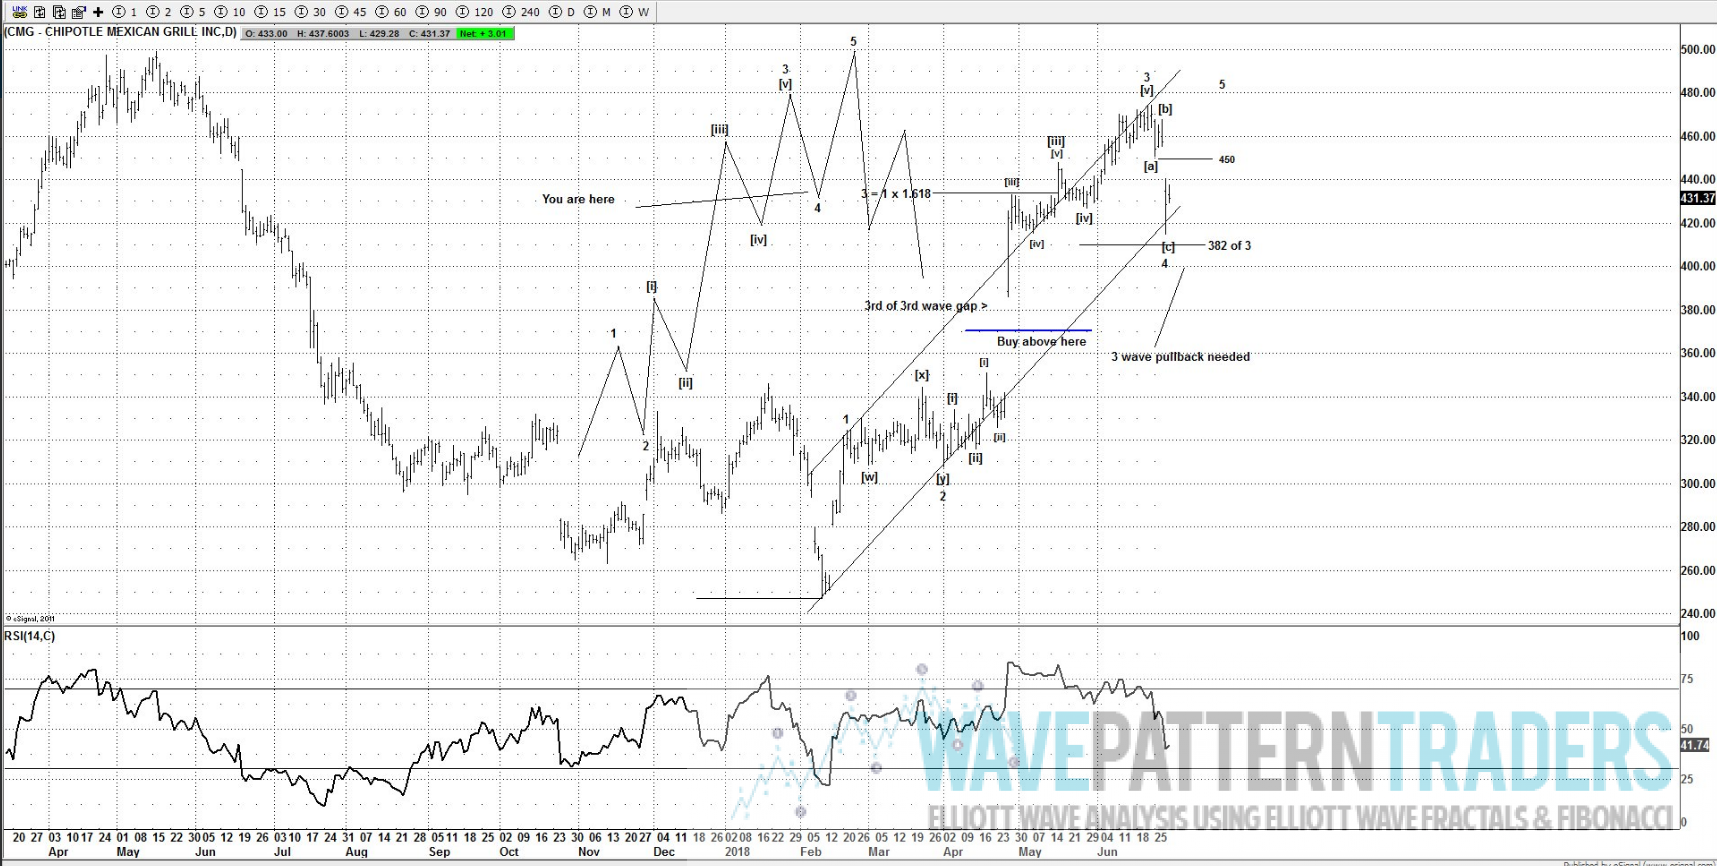
Above 444.37 supports more immediate upside. I would consider other ideas such as a triangle for wave 4 if a break below 444.37.
If you own this stock I would encourage you to think about taking $$$ off the table if new highs are seen to end wave 5 or at least lift stops to 444.37.
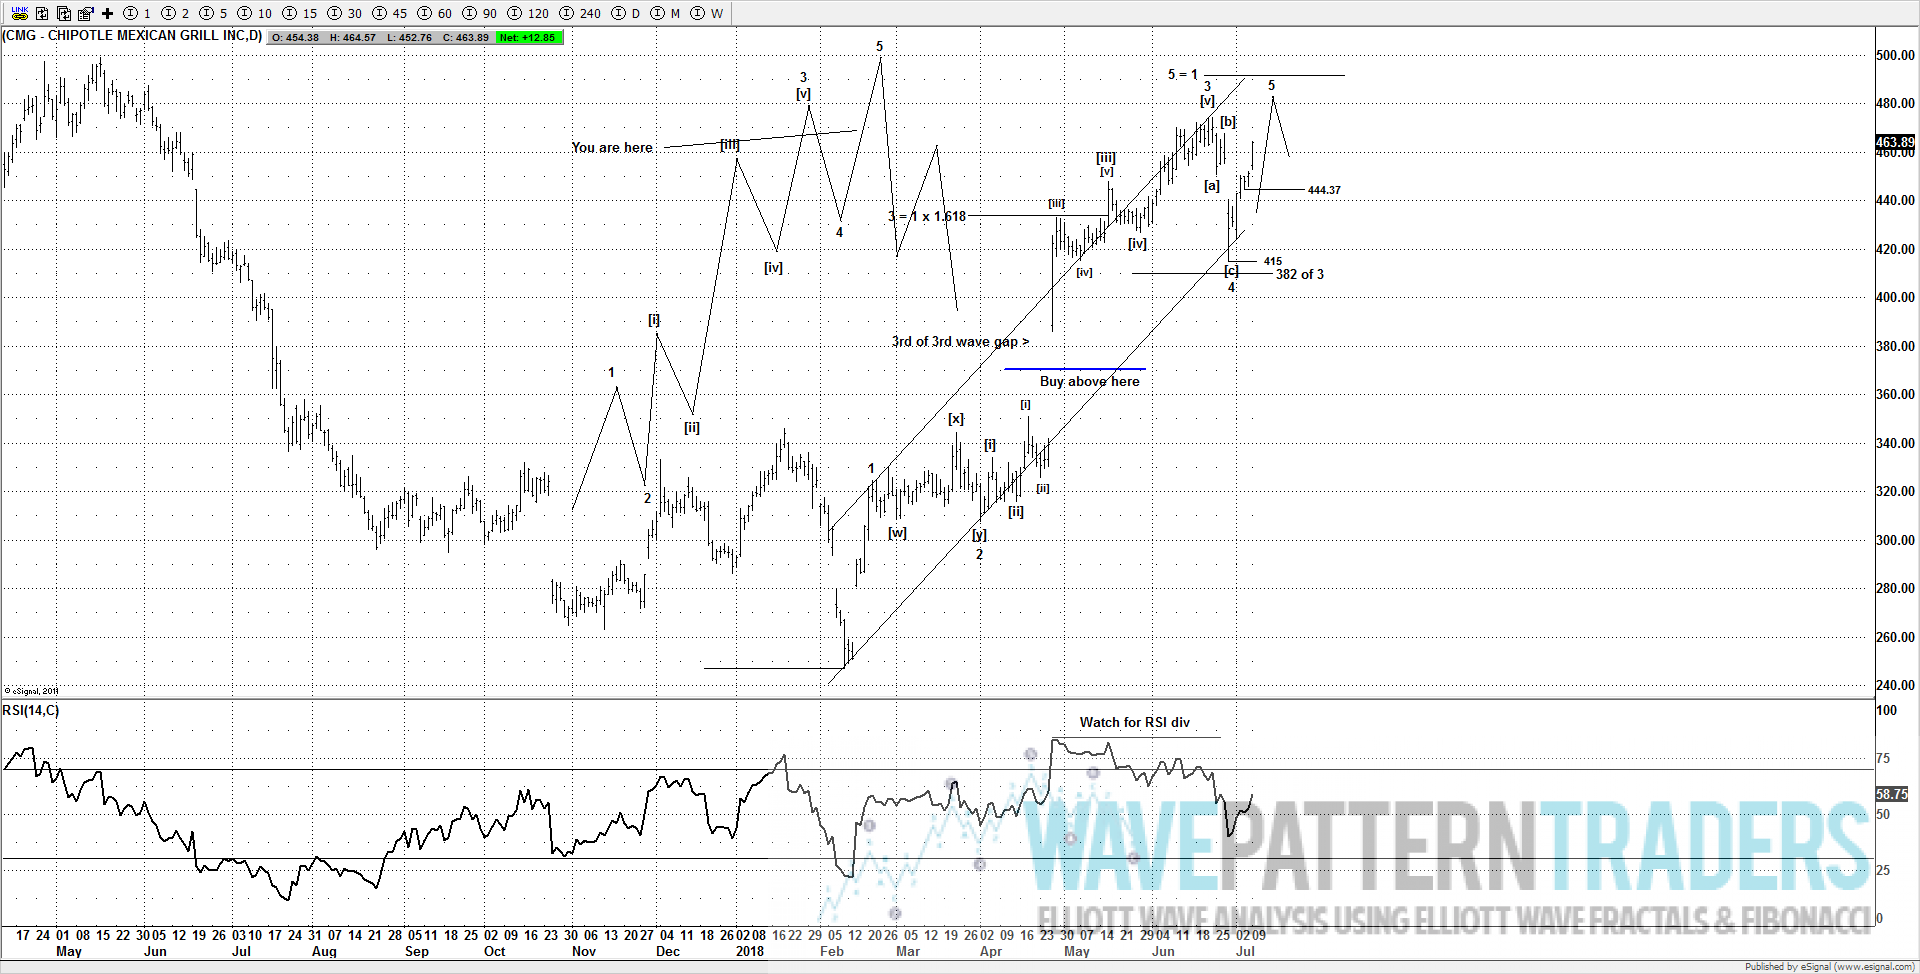
Updated chart. I suspected its now in wave 5.
Alt triangle idea for wave 4.

Do you have a stock that you want evaluating? Purchase a consultation call and get an independent review through the lens of Elliott Wave. With the US stock markets vibrating around the previous all time highs, it may be prudent to think about protecting any gains you have.
Click here to purchase a consultation call CLICK HERE
Click here to purchase a Elliott Wave report CLICK HERE
Note: If you are a member, you can email me or send a tweet for an update if you are thinking about trading this stock.