With the new high its technically possible to label 5 waves from the 2016 lows, however I think its prudent to give the benefit to the bulls, a new high could be counted as a B wave of a running triangle or an expanded flat. Ideally a decline is seen towards 330.00 to end wave C of a triangle. If a move below the Feb 2018 lows, then an expanded flat pattern would be favored to end wave [4].
If you own this stock you want be careful as the new high could be a nasty bull trap.
Idea 1 (running triangle)
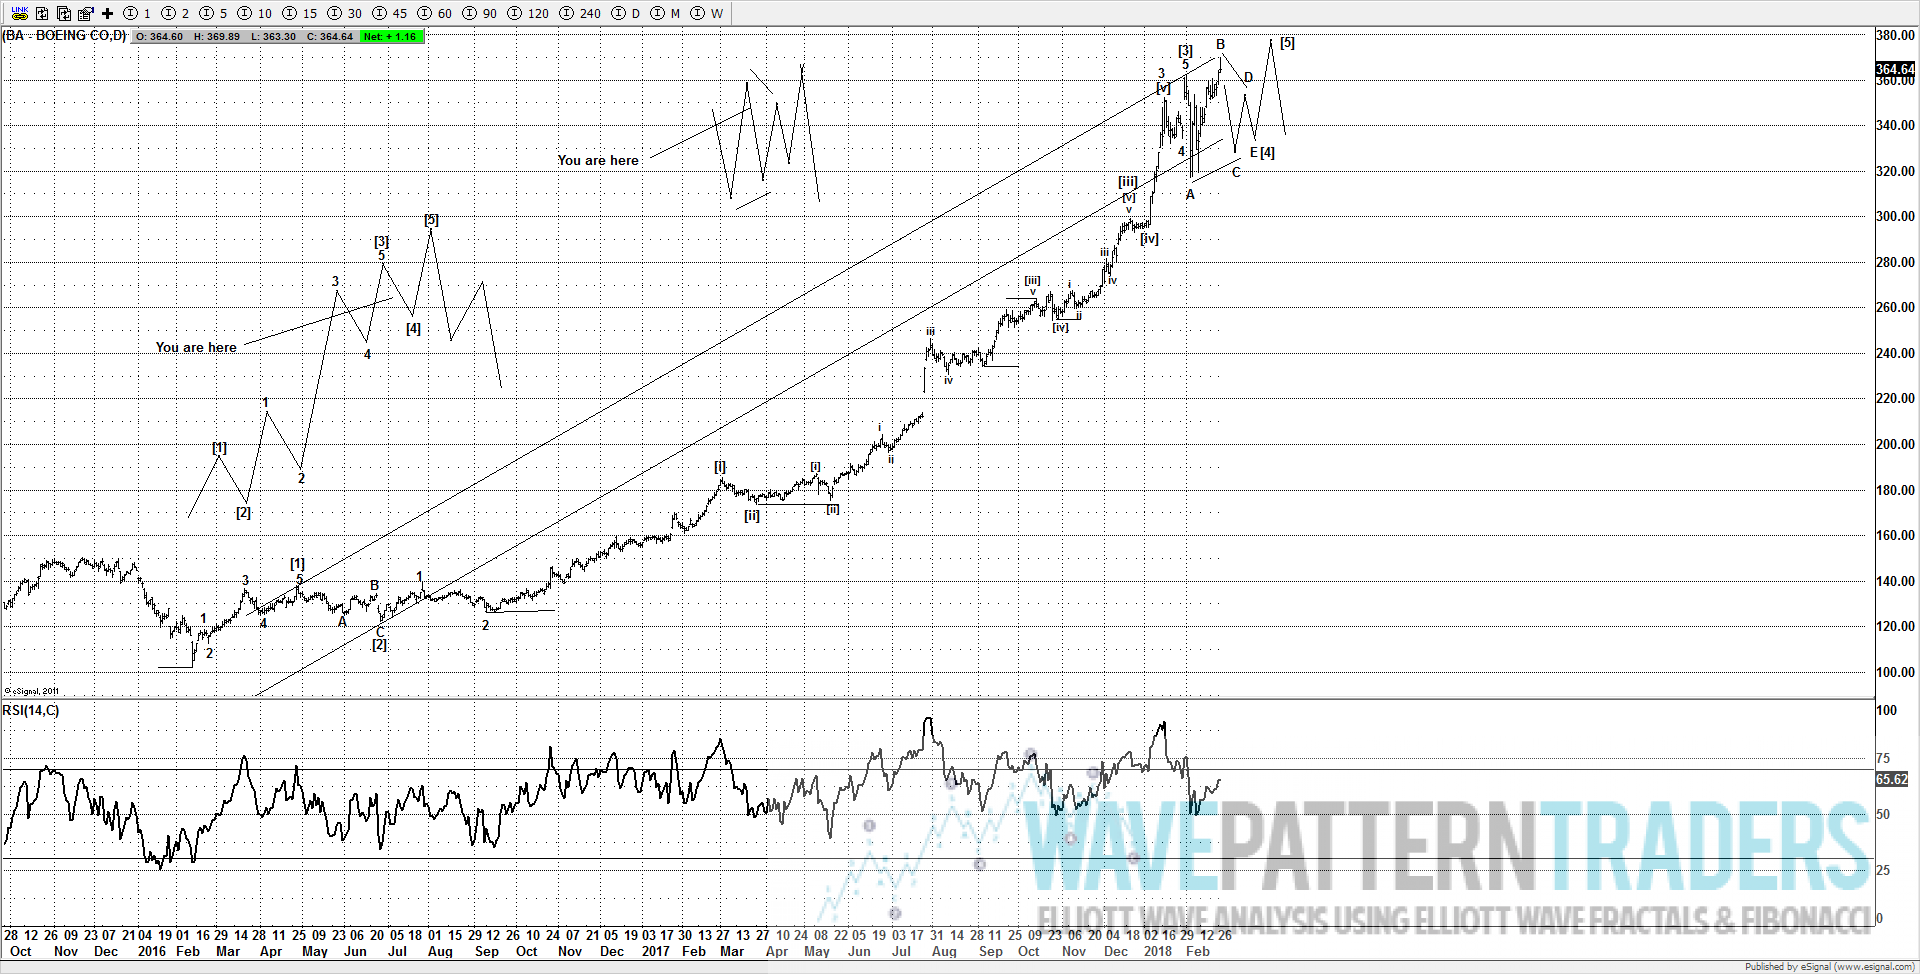
Idea 2 (expanded flat)

Idea 3 (topping and ending wave [5] as well as the trend from the 2016 lows).

Do you have a stock that you want evaluating? Purchase a consultation call and get an independent review through the lens of Elliott Wave. With the US stock markets vibrating around the previous all time highs, it may be prudent to think about protecting any gains you have.
Click here to purchase a consultation call CLICK HERE
Click here to purchase a Elliott Wave report CLICK HERE
Note: If you are a member, you can email me or send a tweet for an update if you are thinking about trading this stock.