Elliott Wave Analysis of DUST (Gold Miners Bear 3x Shares ETF)

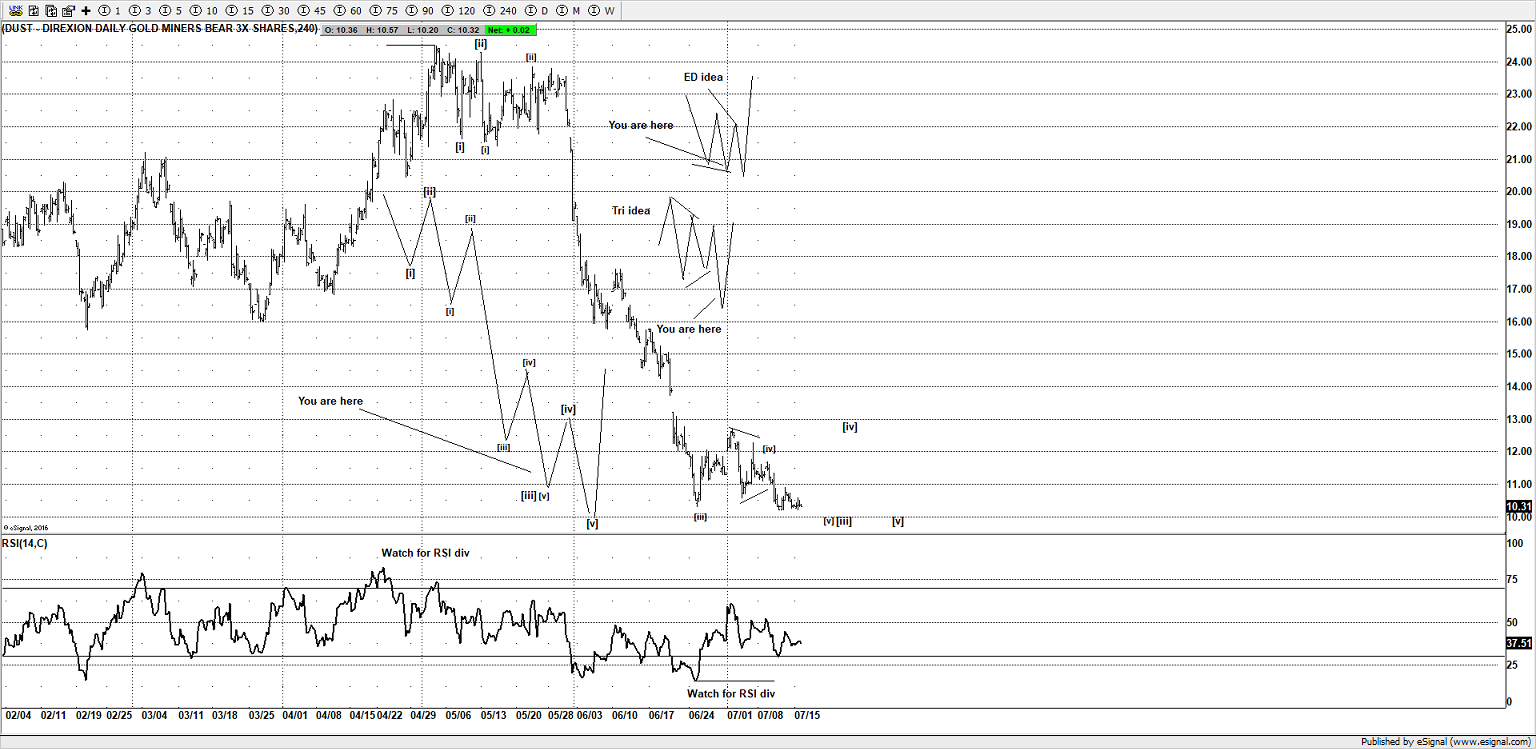
The strong decline over the last few weeks appears to argue for an impulse wave, I suspect it’s close to ending a 3rd wave, so an up-down sequence is still favored before it completes 5 waves from the May 2019 high.

I favor its very close to seeing a bounce for wave [iv], although I am still expecting to see further weakness for wave [v] thereafter once wave [iv] ends, however, I do think a new high on the GDX needs to be watched, as it too can end wave [iii] of an impulse wave, although in the opposite direction.

The better buy on DUST would be when all 5 waves are completed, but for those that are long Gold stocks, and want to consider a hedging strategy, then buying some DUST could be a good idea.
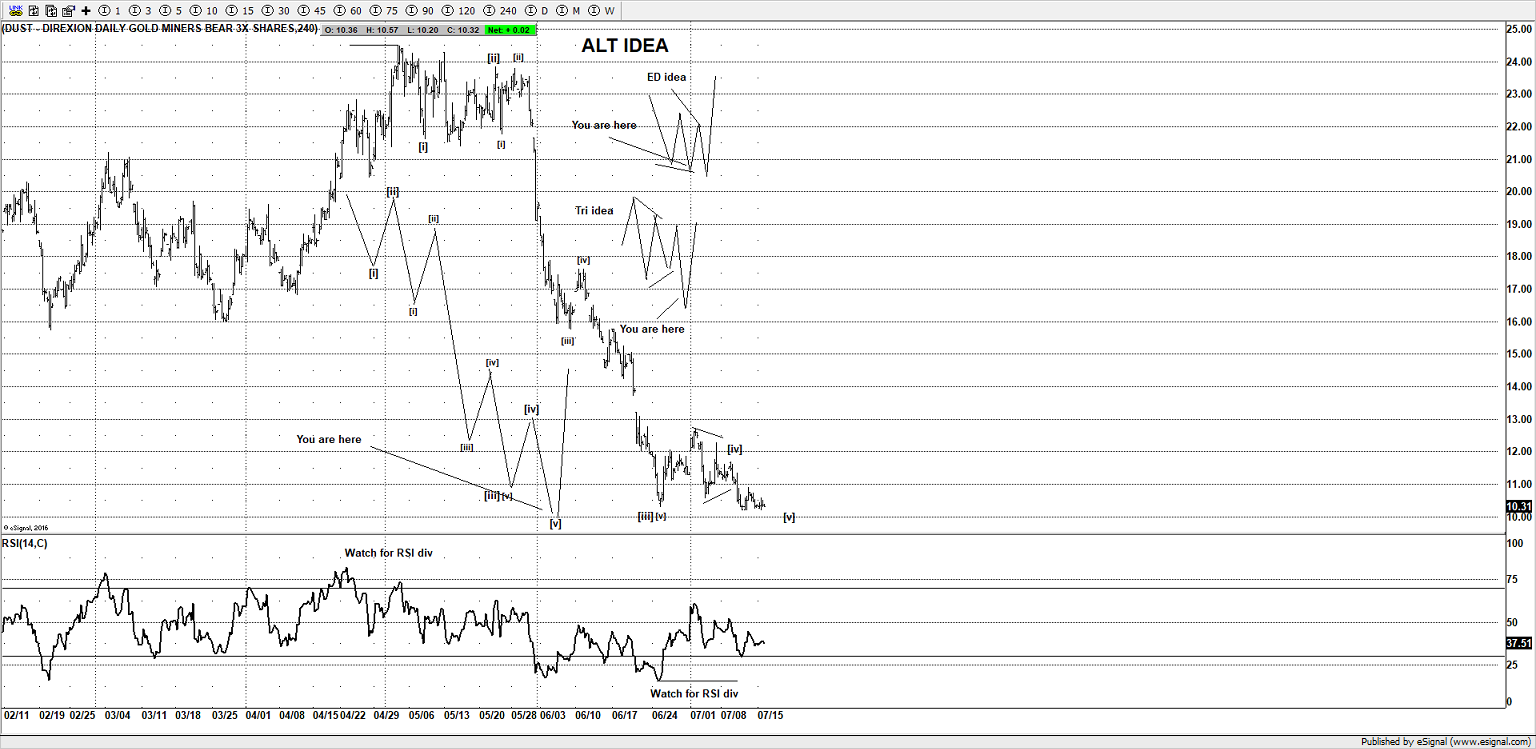
Alt idea

There is a way to actually count the current decline as a 5th wave of an impulse wave from the May 2019 high, however the look on the GDX is not that great, so the preferred idea on DUST is the idea shown above, but if needed then I would consider a possible peak in place on the GDX and low in place to end 5 waves on DUST if we saw a much stronger move above 14.00 – 14.50.

Need to know where GDX is likley going next?

Click here to sign up for updates for Gold, Silver, GDX, Crude oil and occasional updates for Natural Gas

CLICK HERE

Try it out for 30 days risk-free. Simply cancel before the first month for a full refund, no questions asked*

*New members only

Elliott Wave Analysis of Grayscale Bitcoin Trust (GBTC)

A new high could well mark an important peak to the trend that has been developing from the Feb 2019 lows, ideally we see new highs to end wave 5 of a large impulse wave, with sentiment extremely bullish on Bitcoin, I would caution readers that are considering getting involved in this product or even buying Bitcoin to reconsider that idea.

If the current idea is an impulse wave as I am showing (5 wave advance) then it’s close to setting up for a large reversal and a substantial retracement in 3 waves.  A pullback in 3 waves is the ideal area for those that want to buy, buying the market after such an advance, in my opinion, is akin to picking up pennies in front of a steamroller.

Elliott Wave Analysis of Zendesk Inc (ZEN)

The recent gyrations over the last few weeks, appear to be taking the shape of a possible bearish rising wedge, Elliott Wave calls this pattern an ending diagonal.

Essentially it’s a terminal pattern. A strong move below $83.60 is needed to support a reversal, as it may still chop and grind higher but remains in the overall wedge shape. An impulsive move under $83.60, then $80.00 would be a strong sign to argue that its likely completed an impulse wave (5 wave advance) from the Nov 2018 low and potentially a much larger impulse wave from the 2016 lows, which would be significant as it can further support a large retracement towards $45.00 – 40.00.

I would watch the price action over the following days if you own this stock, as the rising wedge is a basic reversal pattern that is supportive of a pending reversal.

Do you have a stock that you want evaluating? Purchase a consultation call and get an independent review through the lens of Elliott Wave. With the US stock markets vibrating around the previous all-time highs, it may be prudent to think about protecting any gains you have.

Click here to purchase a consultation call CLICK HERE

Click here to purchase a Elliott Wave report CLICK HERE

Note: If you are a member,  you can email me or send a tweet for an update if you are thinking about trading this stock.

Elliott Wave Analysis of GBPUSD

I suspect a relief bounce is close at hand for some of the GBP pairs, when we look at the decline from the May 2019 high, the new low on pairs such as GBPCHF and GBPCAD are supportive that the new low on GBPUSD is most likely the 5th wave of an impulse wave (5 wave decline) from 13176.

A partial rally in 3 waves is favored soon, that can offer an opportunity for traders that are looking to sell GBPUSD, stops need to be placed at 13176. That is likely to align with a bounce on pairs like GBPCHF and GBPCAD etc.

Our bigger picture ideas on GBPUSD are still targeting a move under 12444 towards 12400 – 12300.

GBPUSD

GBPCHF

GBPCAD

Note:

Unless a complete reversal above the May 2019 highs, then all the pairs listed in this article are on a sell. A retracement in 3 waves to correct the decline from the May 2019 high is favored soon, once wave [v] ends.

Sign up here to get updates for GBPUSD and 8 more pairs  CLICK HERE

Further details can be found on the pricing page. CLICK HERE

Use the discount code 532F4B4CCA to get a 50% discount from your first month.

Elliott Wave Analysis of SPY (SPDR S&P 500 ETF) Update

Since the last post, its declined nicely, the completion of a 5 wave decline from 295.38 into 279.74, followed by a bounce could suggest the move from 279.74 is close to ending or possibly completed at  289.25.

A strong move below 285.00 is needed, followed by an impulsive decline below 282.00, would be a strong sign to further support a move lower. Initial downside targets reside around 274.00, although based on the next decline will help decide if the move from 295.38 will develop into a 3 wave decline, which is bullish, or a 5 wave decline, which would be bearish.

The current idea is wrong above 295.38.

Last post : https://www.wavepatterntraders.com/elliott-wave-analysis-of-spy-spdr-sp-500-etf-2/

Sign up here to get updates for the SPX as well as other US markets  CLICK HERE

Further details can be found on the pricing page. CLICK HERE