Elliott Wave Analysis of Yum China Holdings (YUMC)

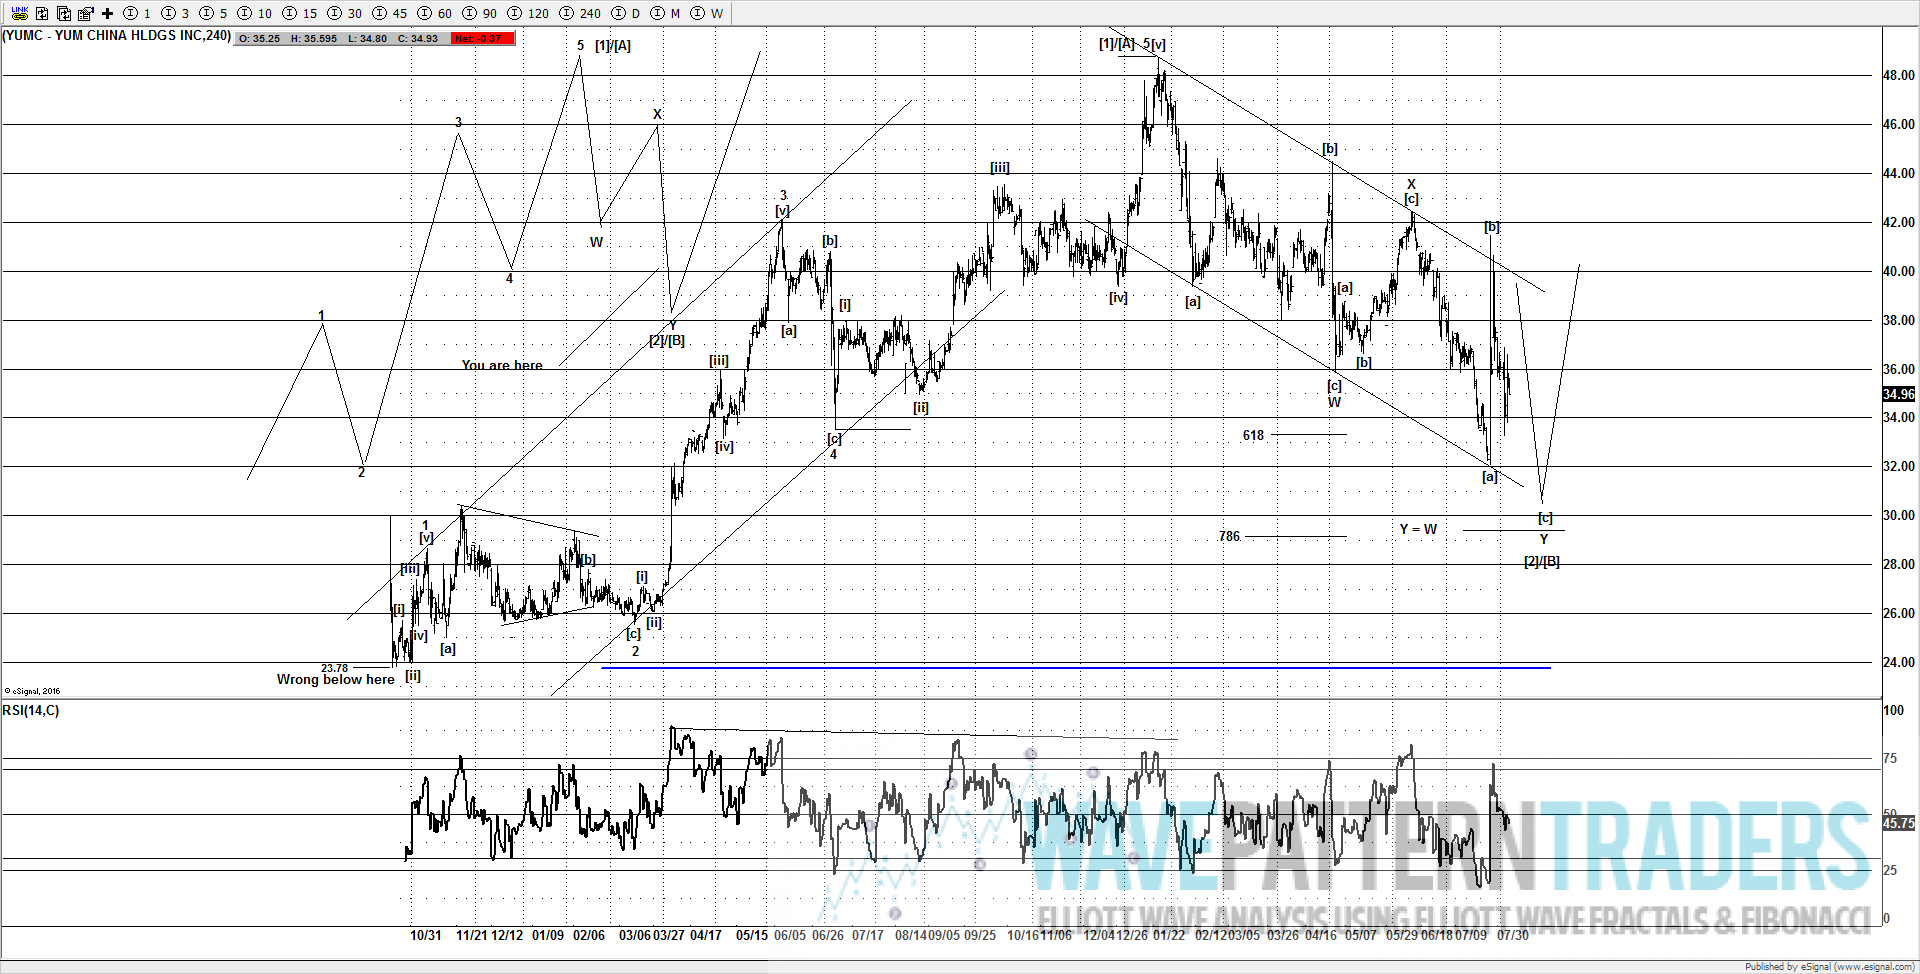
There is not a lot of price action we can use, so this is a very speculative idea, but whilst this stock remains above 23.78 it has a potential bullish setup if the current decline from the Jan 2018 highs remains as a corrective decline as shown. Short term I think it would look far better if a minor new low was seen towards 29.00 – 31.80. If the current for wave [2]/[B] is a double zigzag as I am counting, then a minor new low could well end the whole decline from the Jan 2018 highs and setup for a move higher and at least a test of 49.00 or higher.

Below 23.78 negates the idea, but frankly I would not want to see it move below 28.00 or it could be forewarning of a larger breakdown under 23.78. A strong move above 42.00 is needed to support a move higher for either wave [3] or wave [C].

Do you have a stock that you want evaluating? Purchase a consultation call and get an independent review through the lens of Elliott Wave. With the US stock markets vibrating around the previous all time highs, it may be prudent to think about protecting any gains you have.

Click here to purchase a consultation call CLICK HERE

Click here to purchase a Elliott Wave report CLICK HERE

Note: If you are a member,  you can email me or send a tweet for an update if you are thinking about trading this stock.

Elliott Wave Analysis of the NDX

Has the NDX topped?

With the strong downside and weekly bar reversal, there is a strong suggestion that the NDX has potentially put in a meaningful peak. I can make the case, not only has it ended the advance from the April 2018 lows, its also possible to suggest its completed an impulse wave from the 2016 lows as well. So thats a very bearish setup. More weakness is needed and follow through next week, but if the recent peak has ended a larger impulse wave from the 2016 lows, then a significant decline is likely underway.

Initial targets are a move back towards the April lows around 6500 – 6300. Based on the way it declines will help decide if a larger breakdown is also going to be seen. The current idea would be negated if a move back above the recent high made last week. A small 5 wave decline on a 30-60 min time frame would further offer strong evidence of a major trend in change.

NDX

COMPQ

SPX

Readers may have noticed that the SPX failed to confirm the NDX advance and move to a new all-time high. Looking at the history of the SPX over the last 18 years, I noticed that the SPX has made very deep retracements towards the 88.6% a few times before its continued lower, most noticeably in the years 2000 & 2015.

If the current advance follows a similar path to that of the years 2000, 2011 & 2015, then we can expect to see a decline next week and more follow through to the downside, which would also align nicely with the NDX and other tech indexes moving lower.

Sign up here to get updates for the NDX as well as other US markets  CLICK HERE

Further details can be found on the pricing page. CLICK HERE

Elliott Wave Analysis of SPY (SPDR S&P 500 ETF)

The choppy downside from the recent highs at 281.18 maybe arguing for a triangle for wave [iv], initially when I was looking for a dip for wave [iv], I expected it to be a deeper move towards 277.00, although the QQQs dipped lower for its wave [iv] from the NFLX earnings result, the ES/SPY failed to follow, which was a little disappointing, however the choppy weakness shown from 281.18 may still be supporting a triangle for wave [iv].

If any weakness fails to breakdown under 278.35, then there is still possibility we see further upside and new highs above 281.18 for wave [v].  Going into next week, the bears need to continue to push the market lower and break under 278.35 to support more weakness. Failure to move below 278.35 would support a triangle for wave [iv] and setup for new highs above 281.88 for wave [v] and complete an impulse wave from the Jun 2018 lows. Its then I would expect a reversal and move lower.

If the market has ideas about further weakness, then I would expect it to stay below 280.47, followed a breakdown under 278.35. Overall the market remains bullish whilst its above the Jun 2018 lows, if any larger breakdown is going to occur, then it needs a full retracement of the advance from the the Jun 2018 lows.

Idea 1

Idea 2

Sign up here to get updates for the SPX as well as other US markets  CLICK HERE

Further details can be found on the pricing page. CLICK HERE

Elliott Wave Analysis of NQ (E-mini Futures)

With the new high on the RSI the current wave structure appears to be a make the case its likely the end to a 3rd wave of an impulse wave from 6954. So the preferred idea is to see a pullback for wave [v] as shown, followed by further upside to end an impulse wave (5 wave advance) from 6954.

It would need a big move under 7150 to be an issue for the current idea, but from what I can see, there appears to be a down-up sequence missing to develop a 9 swing advance from 6854 (9 swings suggests an extended wave, in this case its wave [iii], as that subdivides into 5 smaller waves).

A common target for a 3rd wave is a 2.618 extension of wave 1, in this case its now hit that area, so its at a band of resistance to suggest wave [iii] is close to ending and setting up for a pullback for wave [iv]. The bigger picture ideas are reserved for members, but based on the structure I still like to idea of a potential major top setting up, once this suspected impulse wave ends from 6954.

I actually thought the advance ended at the Jun 2018 highs, so this new high supports an alt idea we have been tracking.

Sign up here to get updates for the NQ as well as other US markets  CLICK HERE

Further details can be found on the pricing page. CLICK HERE

Elliott Wave Analysis of Chipotle Mexican Grill (CMG)

The upside above 460.00 is further supporting the idea of a move to new highs for wave 5 and complete an impulse wave from the Feb 2017 lows, barring a more complex pattern such as a triangle for wave 4, then continue to target new highs above the Jun highs. There is a measured move target near the 492.00 area that can act as resistance and suggest sellers arrive, but any new high above the wave 3 highs (Jun highs) would be enough to suggest wave 5 is completed.

Above 444.37 supports more immediate upside. I would consider other ideas such as a triangle for wave 4 if a break below 444.37.

If you own this stock I would encourage you to think about taking $$$ off the table if new highs are seen to end wave 5 or at least lift stops to 444.37.

Updated chart. I suspected its now in wave 5.

Alt triangle idea for wave 4.

Do you have a stock that you want evaluating? Purchase a consultation call and get an independent review through the lens of Elliott Wave. With the US stock markets vibrating around the previous all time highs, it may be prudent to think about protecting any gains you have.

Click here to purchase a consultation call CLICK HERE

Click here to purchase a Elliott Wave report CLICK HERE

Note: If you are a member,  you can email me or send a tweet for an update if you are thinking about trading this stock.