Elliott Wave Analysis of Octa (OKTA)

The advance from the 2017 has enough gyrations to suggest a potentially completed impulse wave (5 wave advance). A strong move below 65.00, as well as an impulsive decline, would be a good sign to support further weakness and suggest wave [5] had likely ended. A correction in 3 waves would be favored once any 5 wave advance has ended, so in this case of this idea, a move towards 55.00 – 50.00 would be a good target, from there the bulls can reevaluate the market and decide if any downside is completed.

Do you have a stock that you want evaluating? Purchase a consultation call and get an independent review through the lens of Elliott Wave. With the US stock markets vibrating around the previous all-time highs, it may be prudent to think about protecting any gains you have.

Click here to purchase a consultation call CLICK HERE

Click here to purchase a Elliott Wave report CLICK HERE

Note: If you are a member,  you can email me or send a tweet for an update if you are thinking about trading this stock.

Elliott Wave Analysis of Tilray (TLRY)

Marijuana stocks have been all the rage the last few months, once such stock is Tilray. The advance from the Jul 2018 lows appears to count as a completed impulse wave. There is a clear 5 wave move at the moment, so if any upside stays below 127.32, then there is a strong setup for a potential move lower to correct the advance. A 3 wave decline towards the prior 4th wave is a good target around the 70.00 area, so thats a fair size retracement, but nonetheless a pullback is favored against 127.32.

The large RSI divergence with the last high is a good sign the move into 127.32 is a 5th wave of an impulse wave as I am currently counting.

Do you have a stock that you want evaluating? Purchase a consultation call and get an independent review through the lens of Elliott Wave. With the US stock markets vibrating around the previous all time highs, it may be prudent to think about protecting any gains you have.

Click here to purchase a consultation call CLICK HERE

Click here to purchase a Elliott Wave report CLICK HERE

Note: If you are a member,  you can email me or send a tweet for an update if you are thinking about trading this stock.

Elliott Wave Analysis of Advanced Micro Devices (AMD)

There have been a lot of mentions about this stock on social media and in the media in general such as CNBC etc. I am not surprised as it’s been on a mission the last few weeks; however the recent peak could well have put in a significant peak, especially considering the media attention this stock has got recently.

Whenever a stock or market gets highlighted, it’s generally very close to a turn and usually close to high or low; in this case I can make a solid claim that there are enough gyrations to suggest the advance from the April 2018 lows has ended an impulse wave (5 wave rally).

To support the more bearish idea (Idea 1) and a large move lower to at least correct the advance from the April 2018 lows, then I would want to see a move below 24.90. The alternative idea that I am tracking (Idea 2), suggests the recent high is only that of a 3rd of 3rd wave and a few more gyrations as shown would be seen to extend the advance.

However if we see a big move below 24.90, then I feel the depth of the decline would not be fitting with the prior gyrations and is likely part of a move lower for Idea 1.

If you own the stock you might want to pay attention to the area around 25.90 – 26.00, in my opinion, any weakness should really find buyers if further upside is going to be seen for the alternative idea (Idea 2).

Idea 1

Idea 2 (alt idea)

If history is a guide, then the recent high could be as significant as the prior 2 peaks.

Do you have a stock that you want evaluating? Purchase a consultation call and get an independent review through the lens of Elliott Wave. With the US stock markets vibrating around the previous all time highs, it may be prudent to think about protecting any gains you have.

Click here to purchase a consultation call CLICK HERE

Click here to purchase a Elliott Wave report CLICK HERE

Note: If you are a member,  you can email me or send a tweet for an update if you are thinking about trading these stocks.


Elliott Wave Analysis of Dow Jones Trucking Index (DJUSTK)

This index has been strong recently and is one of the components of the Dow Transportation Average (DJT). I am closely watching the Dow Jones Trucking Index (DJUSTK) for clues to when the DJT will end its advance from the 2016 lows and reverse lower, as it seems that the recent fuel that is driving the Dow Transportation Average (DJT) higher is coming from the rail road and trucking stocks.

Looking at DJUSTK I can make a solid case that it’s close to ending an impulse wave from the 2016 lows and current advance is in a 5th wave, although it may still push a little higher as some of the major stocks in the DJUSTK would look better if new highs were seen, stocks just as SAIA & XOP etc. Once we see new highs or some evidence of a reversal I am expecting the DJT to reverse lower.

One the easiest way to trade a decline on the Transport stocks it to look for ways to sell the ETF IYT that is essentially the equivalent of the DJT.

So if you have access to any of the stock listed, they could be good candidates for a reversal soon and aggressive traders could also think about finding ways to take advantage of a decline on IYT.

DJUSTK

SAIA

XPO

IYT vs DJUSTK

Do you have a stock that you want evaluating? Purchase a consultation call and get an independent review through the lens of Elliott Wave. With the US stock markets vibrating around the previous all time highs, it may be prudent to think about protecting any gains you have.

Click here to purchase a consultation call CLICK HERE

Click here to purchase a Elliott Wave report CLICK HERE

Note: If you are a member,  you can email me or send a tweet for an update if you are thinking about trading these stocks.


Gold Analysis: 3 Ideas Make Tough Trading

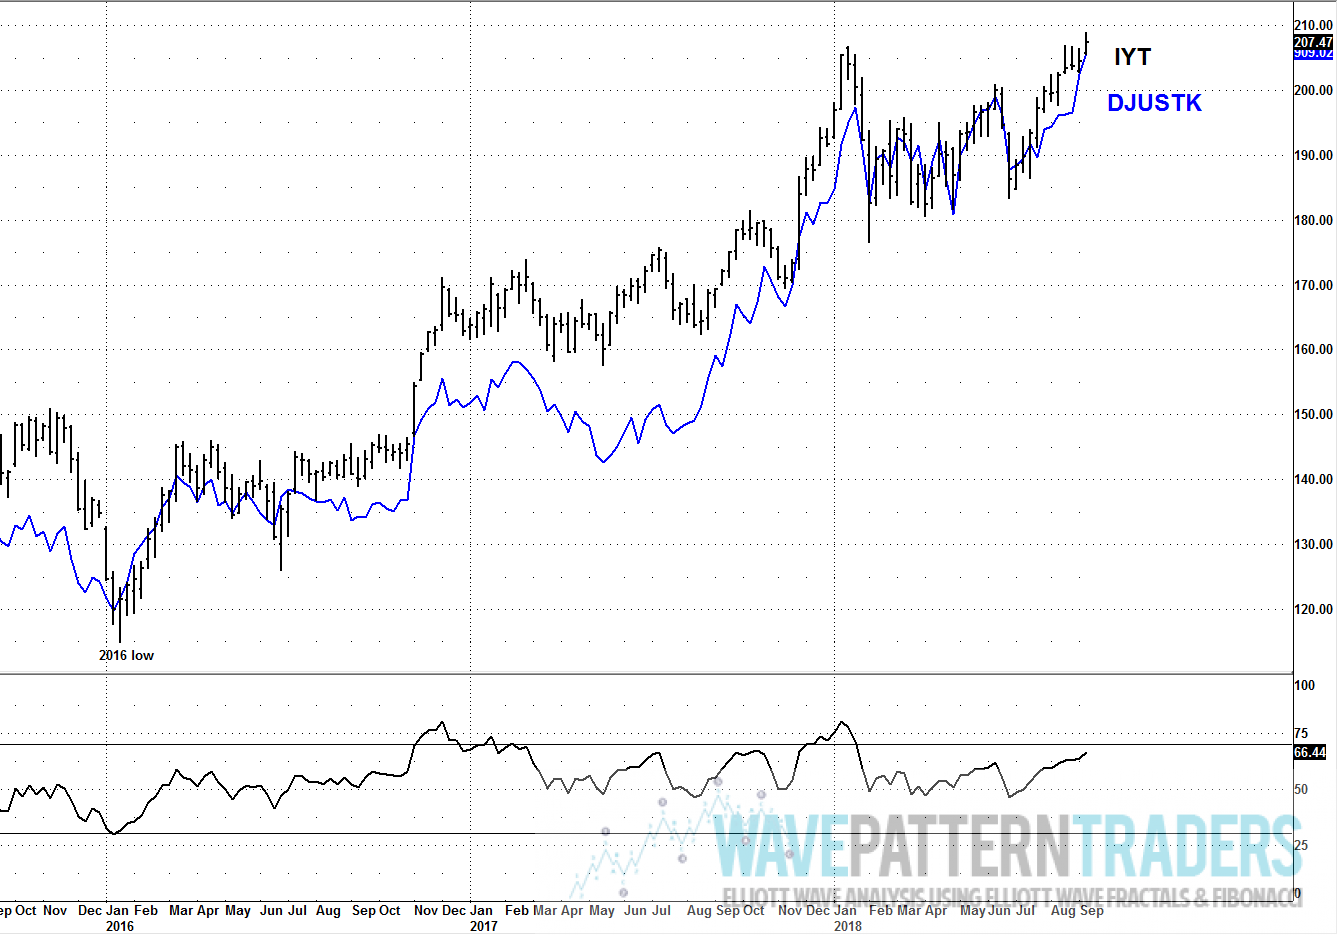
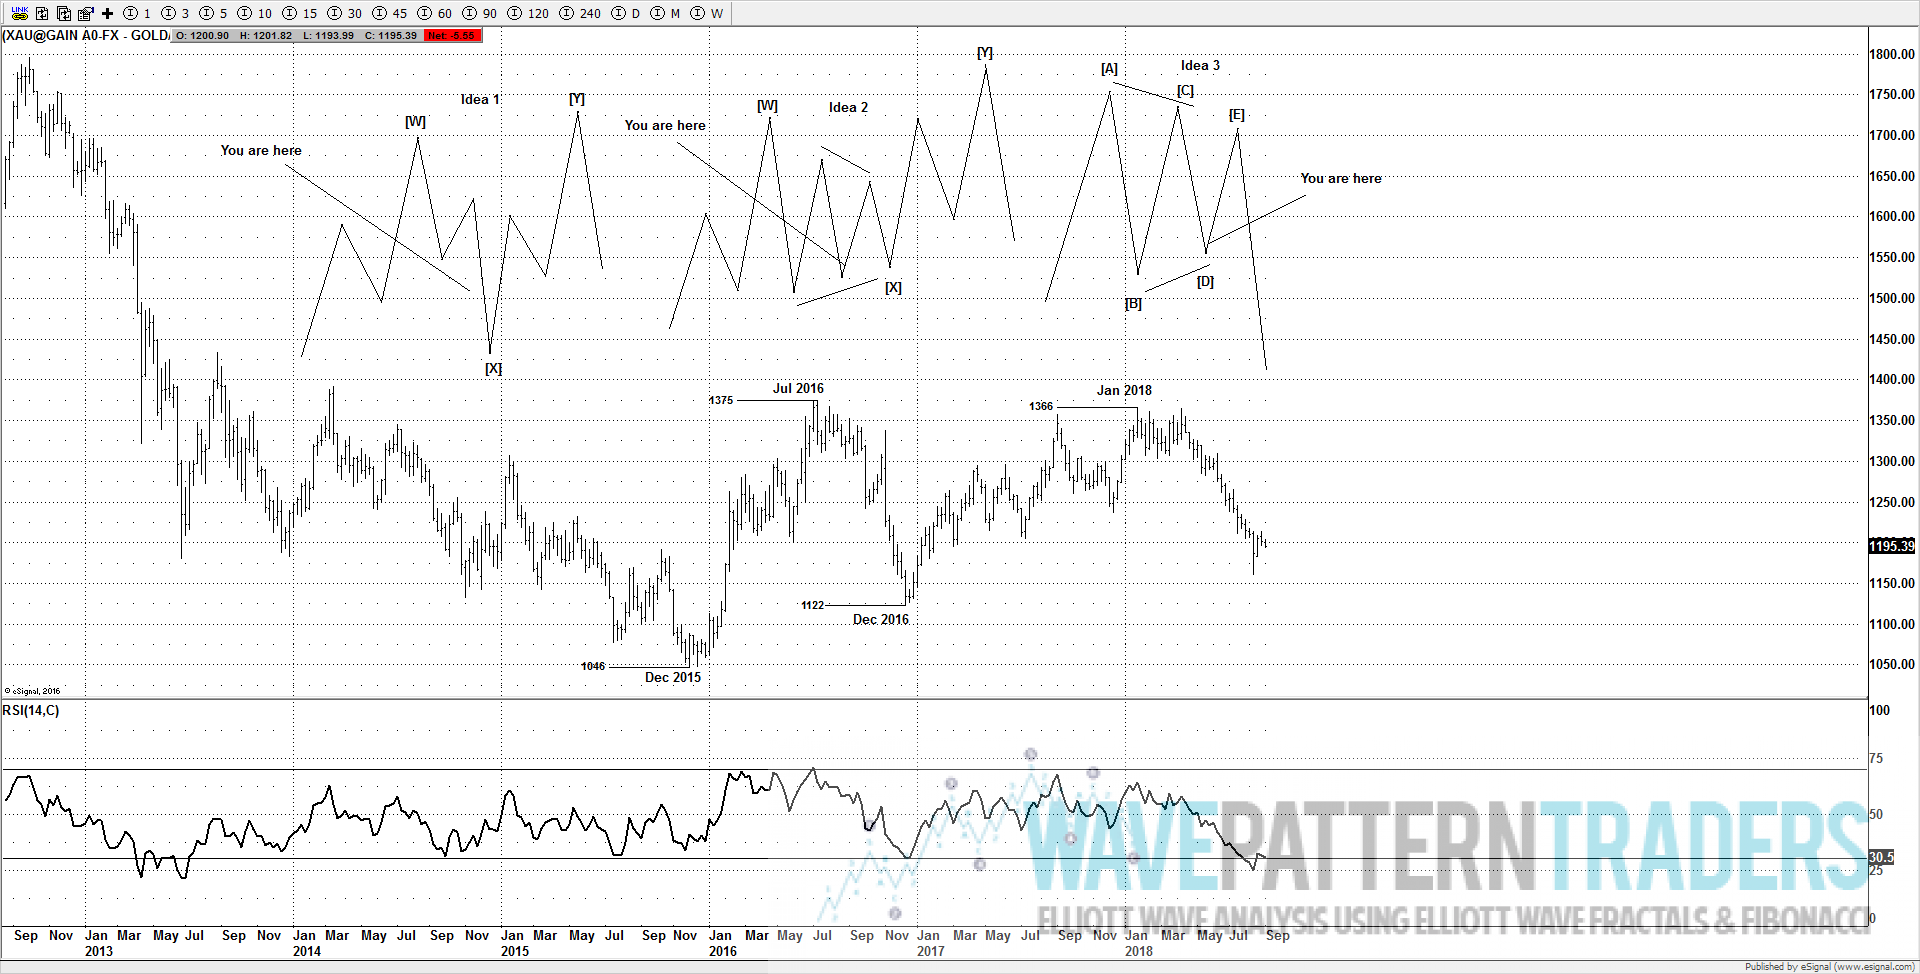
If you have been following Gold over the last few years you are probably frustrated like most Gold bulls are, essentially Gold and Gold stocks have gone nowhere for the past two years, although you could argue that the many Gold stocks have a downwards bias the past two years, but Gold is still above the Dec 2016 lows.

There are a number of patterns that I am currently watching and no one idea has a strong foothold, although if any upside fails to move above $1340, then it will make a better case for Idea 3 and a large triangle has been in progress over the last 2 years.

Both the Ideas 2 & 3 can still argue for some variation of a triangle and a rally towards $1300 – 1320. If however the market continues to move below $1122 (Dec 2016 low), then Idea 1 will be favored and a large 3 wave decline from $1375 is developing for a [X] wave. The lower it moves the more bullish I am based on the idea of at least a rally towards $1300 – 1320 or higher, as the more bearish idea (Idea 3) would still favor a move towards $1300 – 1320 to end the triangle idea.

Corrective patterns are notoriously difficult to predict, let alone trade, as they have a habit of morphing, but a skilled Elliottician can put into context the price action and present some ideas that can help investors and traders make better decisions. It would need a large breakdown under $1060 to consider a possible breakdown is in development, but as it stands I still like the idea of a rally, even if the market moves below $1122 before a move higher starts. If $1160 marks a short term low point, for one of the triangle ideas (Idea 2 or Idea 3). Then a rally towards $1300 – 1320 would be favored over the following weeks.

Technically as long as price remains above $1122 either of the triangle options remain valid, only a break of $1122  (Dec 2016 low) would suggest we consider Idea 1 and look for low around $1100 – 1120 to setup for a rally back above $1375 (Jul 2016 high).

The last idea (not shown) is that a large 3 wave rally from $1046 truncated at $1366 (Jan 2018 high) and the market is about to break down below $1046 (Dec 2015 low). Whilst it’s not one of my favored ideas, it’s not something I can totally rule out as the bigger picture ideas still eventually point to a move back below $1046 to end the decline from $1920.

Sign up here to get updates for Gold. & Silver  CLICK HERE

Further details can be found on the pricing page. CLICK HERE