Is the current risk-on trade about to be derailed?

The look on many markets from the August 2019 low, that are moving in sync with the current risk-on trade, currently have a distinct corrective look to them.

For example, let’s look at an overlay between TBT and USDJPY. Some readers may be aware that generally speaking, USDJPY tends to move higher when a risk-on environment is present in the markets and moves lower with there is a risk-off environment. As you can see both markets have been moving higher since August 2019.

However, the look of the wave structure is what we are really interested in. The advance has a corrective look to it, so it seems to be supporting the idea that the current rallies on risk-on assets are likely a  corrective bounce since August 2019, against the backdrop of the prior declining trends, and not likely to be the start of a strong upward rally. If we had seen a strong upwards rally in 5 clear waves, then it would be a far more bullish clue. However, the overlapping waves and the 3 wave movements are characteristics of a corrective trend as opposed to an impulsive trend.

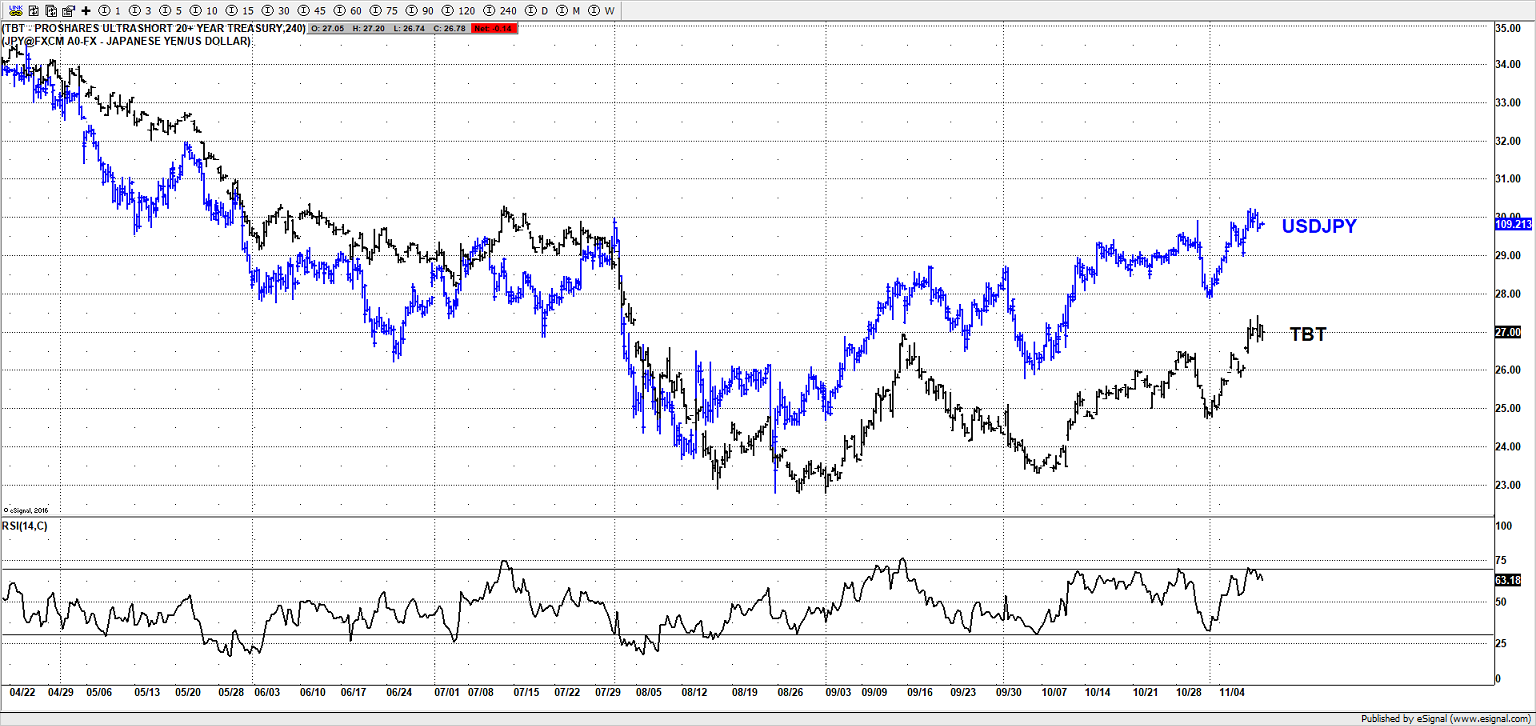
So the expectation is for a move lower on both USDJPY and TBT once the current rallies from August 2019 end. If we add in Gold which has been currently moving lower since early September 2019, we can see there is a decent inverse correlation between TBT, USDJPY, and Gold.

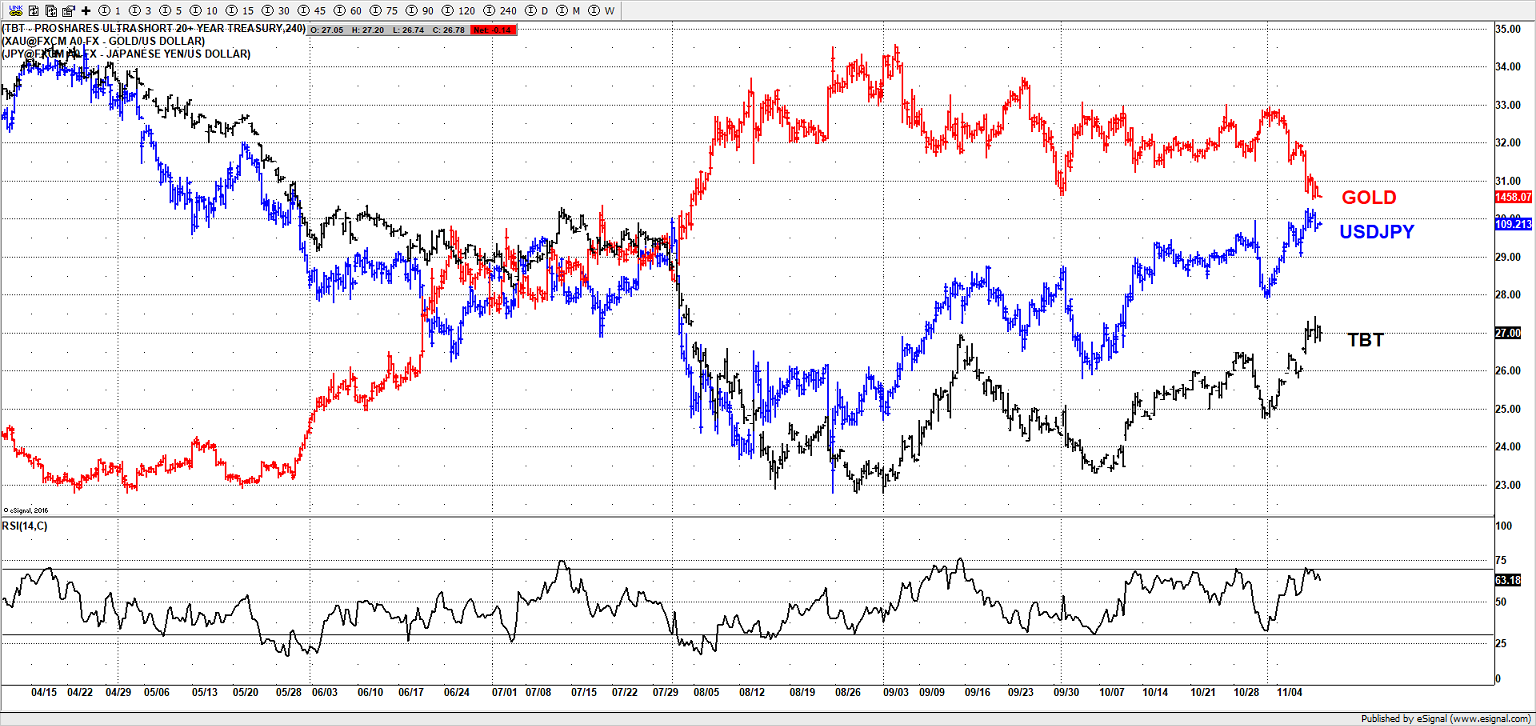
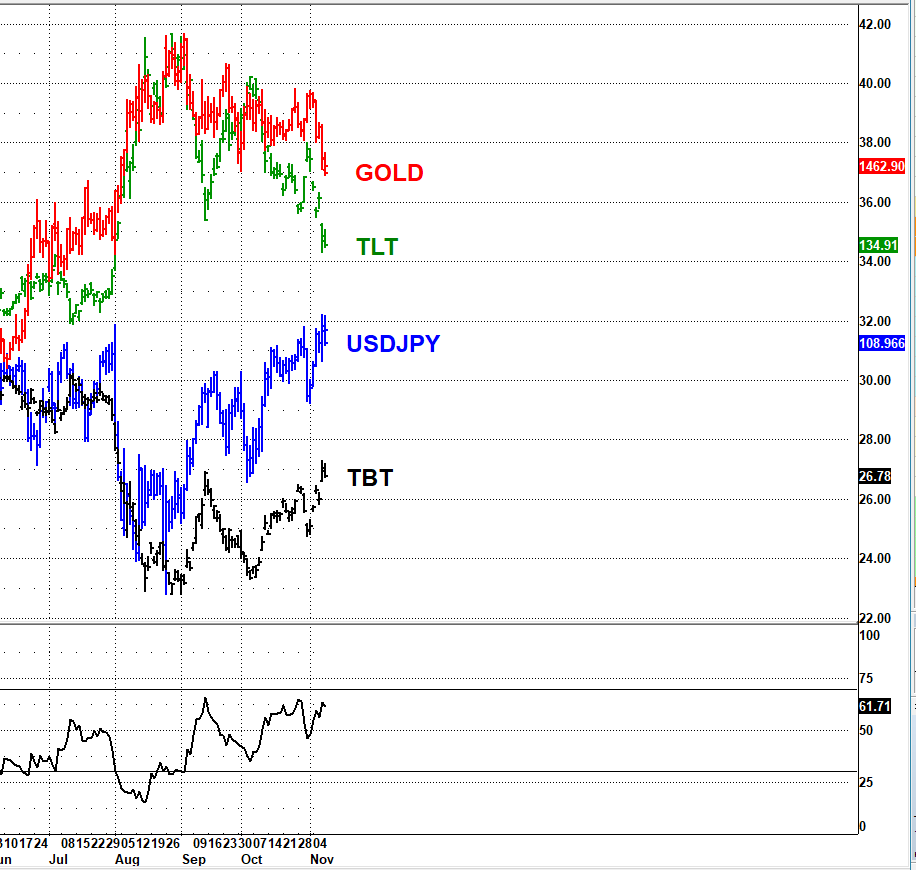
What that essentially means is as the risk-on trade has progressed higher over the last few months, traders/investors have sold Gold and US treasuries (yields higher) and purchased risk-on assets such as USDJPY and equities.

If I am correct about the current risk-on rallies from August 2019 being a corrective advance, then a reversal of that trade should then see a move back into Gold and US treasuries (yields lower), as well as a move away from equities, and money moves from one area of the market into the other.

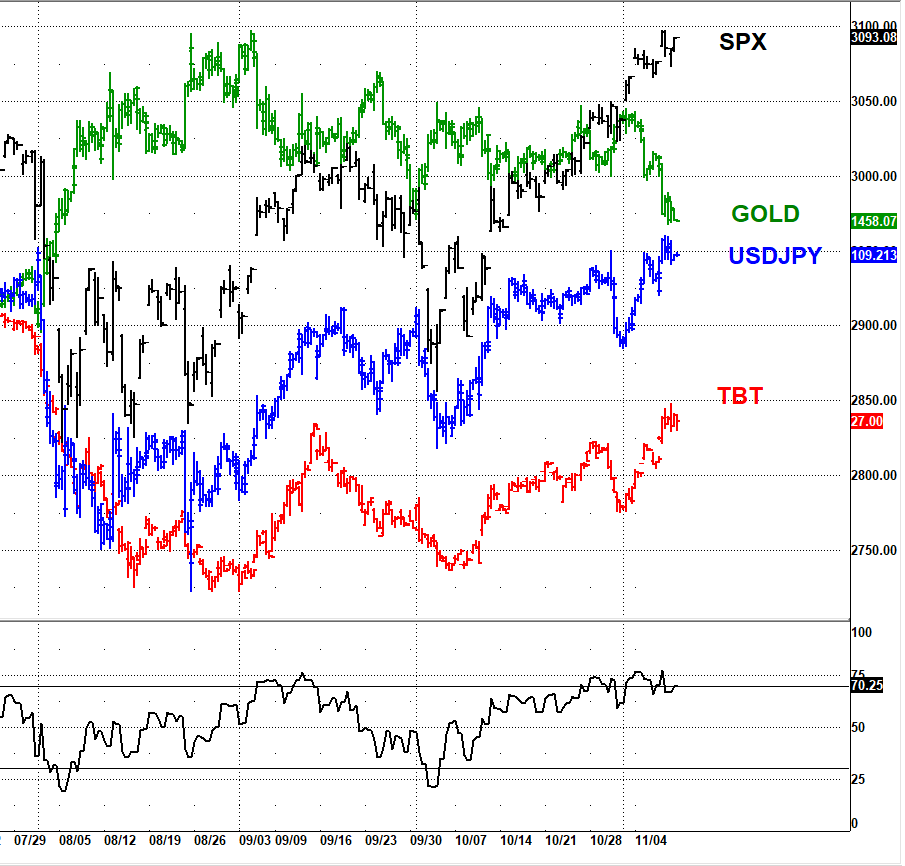
Let’s add the SPX as a proxy for US equities and see if that offers any clues. You can also see US stocks have moved higher, which would make sense if USDJPY was moving higher, as those two markets tend to move well with each other. So if the current risk-on trade is close to reversing as I suspect, then there is a strong chance we see a move lower on US equities, as traders/investors once again move money away from risk-on assets and back into risk-off assets such as TLT, US treasuries, and Gold.

If you overlay the RUT with USDJPY, you can also see a distinct 3 wave move on the RUT from the August 2019 low. Now that may change, but presently the advances on many risk-on markets have a 3 wave look to them from August 2019. If the current advance remains in 3 waves as I have shown, then the current risk-on rally is potentially setting up for a move lower. A move below the October 2019 low would further support a more bearish tone to the markets.

If any weakness in markets such as USDJPY or the SPX remains above the October 2019 low, then it can support a bullish tone to the market and further upside thereafter.

The Case for a Short Term Peak on US and European Stocks

I have been tracking a number of highly correlated markets from the Oct time frame. The new high and low (depending on which market) appears to be the 5th wave of an impulse wave from that’s been developing from Oct 2019. So the expectation as we head into the FOMC this week is a potential reversal setup.

Based on the next move will have big implications going forward. If the moves from October 2019 do not get fully retraced on markets such as the ES or US 10 year notes (ZN), then it’s likely going to support more upside for US stocks, as well as a continuation lower US 10 year notes (yields higher), etc.

If you are looking to buy the dip on US or European stocks, then at least wait for the market to pullback/correct the advance from the Oct low on markets like the ES and FDAX. A 3 wave decline is a bullish setup, a full retracement below the Oct low would be a bearish development.

ZN

FDAX

ES

ZN vs FDAX & ES

Elliott Wave Analysis of GDX

Yesterday’s upside on the GDX, potentially could be the start of a move higher for wave 5 of an impulse wave that has been developing since Sept 2018. Short term if it continues to hold above $26.63 then more upside can be seen, although it’s crucial that the bulls push the market above $28.00, then $28.45 to further support a move higher.

A move back below $26.63 likely sees a new low for a 5th wave of a possible ending diagonal to end wave [c] of wave 4. Barring a major breakdown below $25.00, then the bullish case is still the preferred idea, although I would like to see a move above $28.45 to feel more comfortable that a rally is underway for wave 5.

Idea 1

Idea 2

Elliott Wave Analysis of EURUSD

I suspect the current rally from the Oct low at 10879 is developing as an impulse wave (5 wave rally). It seems to be missing some gyrations before it counts as a completed structure. An impulse wave that has one extended section will develop in 9 swings. So far I can count 6 possible swings from 10879, so a few more gyrations as shown are needed before it counts as a completed 9 swing advance from 10879.

Barring a move below 11062, then allow for more upside to end wave [iii], a pullback again would be expected for wave [iv], followed by new highs for wave [v]. Once we can count 9 swings from 10879 to complete the current wave structure, it’s then we can consider a much larger decline to correct the move from 10879.

Short term, above 11062 keeps it pointing higher. A 5 wave advance from 10879 could well suggest a significant low is in place at 10879, as well as a significant peak for the DXY.

Elliott Wave Analysis of Grayscale Bitcoin Trust (GBTC)

The new low potentially can end a corrective decline from the high made at $17.14. Before the current decline I was targeting a move towards $9.00 – 8.00 and BTC/USD to test $7400. I felt a substantial pullback would be needed to shake off the Johnny-come-lately’s (bulls that buy into the euphoria of a 5th wave). So far we have seen a substantial pullback and likely to have kicked off many of the bulls that bought into the spike into $17.41.

The more pessimism, the better, to establish a significant low, you want the masses to be again following the status quo. So the same traders that chased into the spike at $17.41 are the same traders that are selling or bearish after a substantial pullback. Nothing moves in straight lines.

‘For your gain, someone has to feel the pain’.

A strong rally above $10.50, then $12.00 is needed to further support a move higher, although an initial advance in 5 waves would be a great start to suggest a low is in place for the end to wave Y.

Before

After