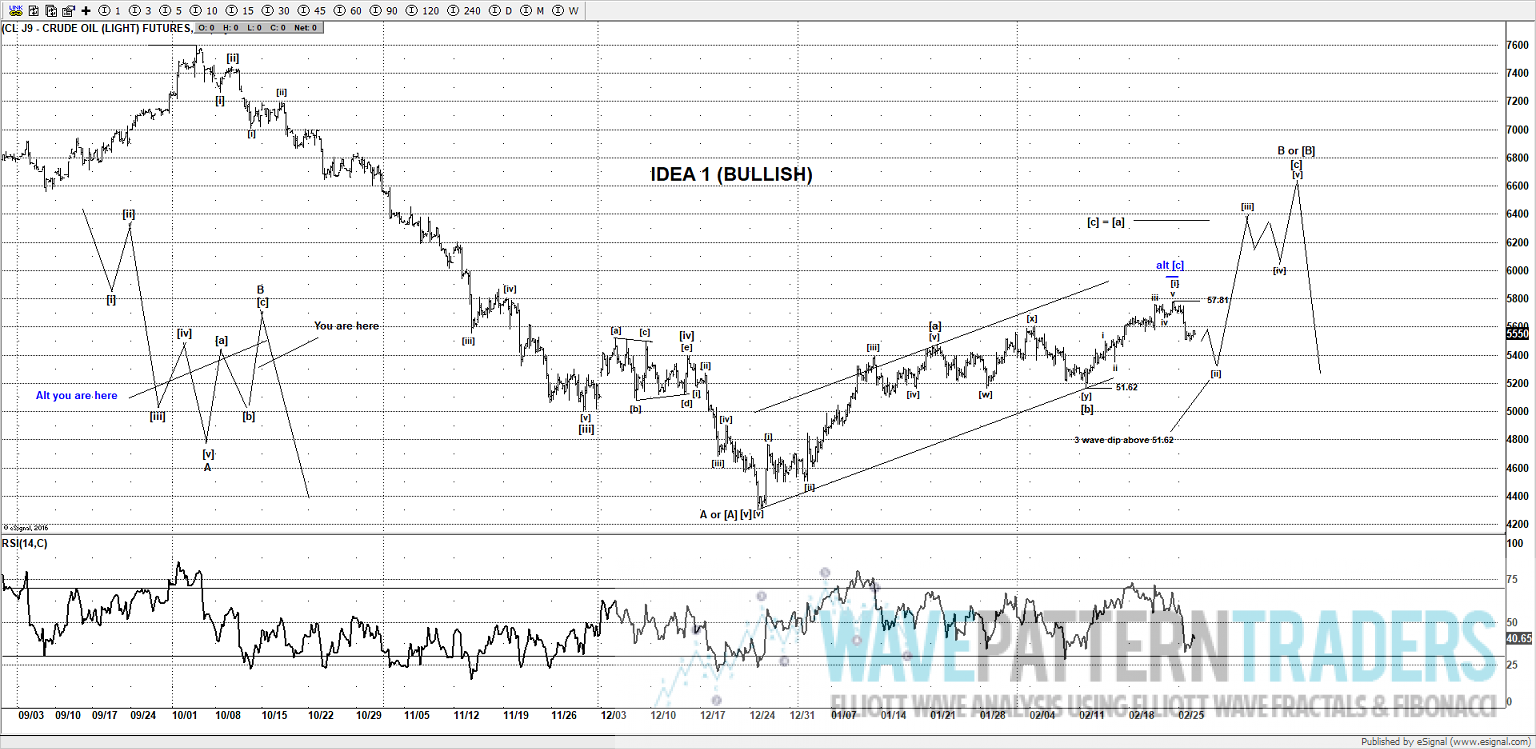
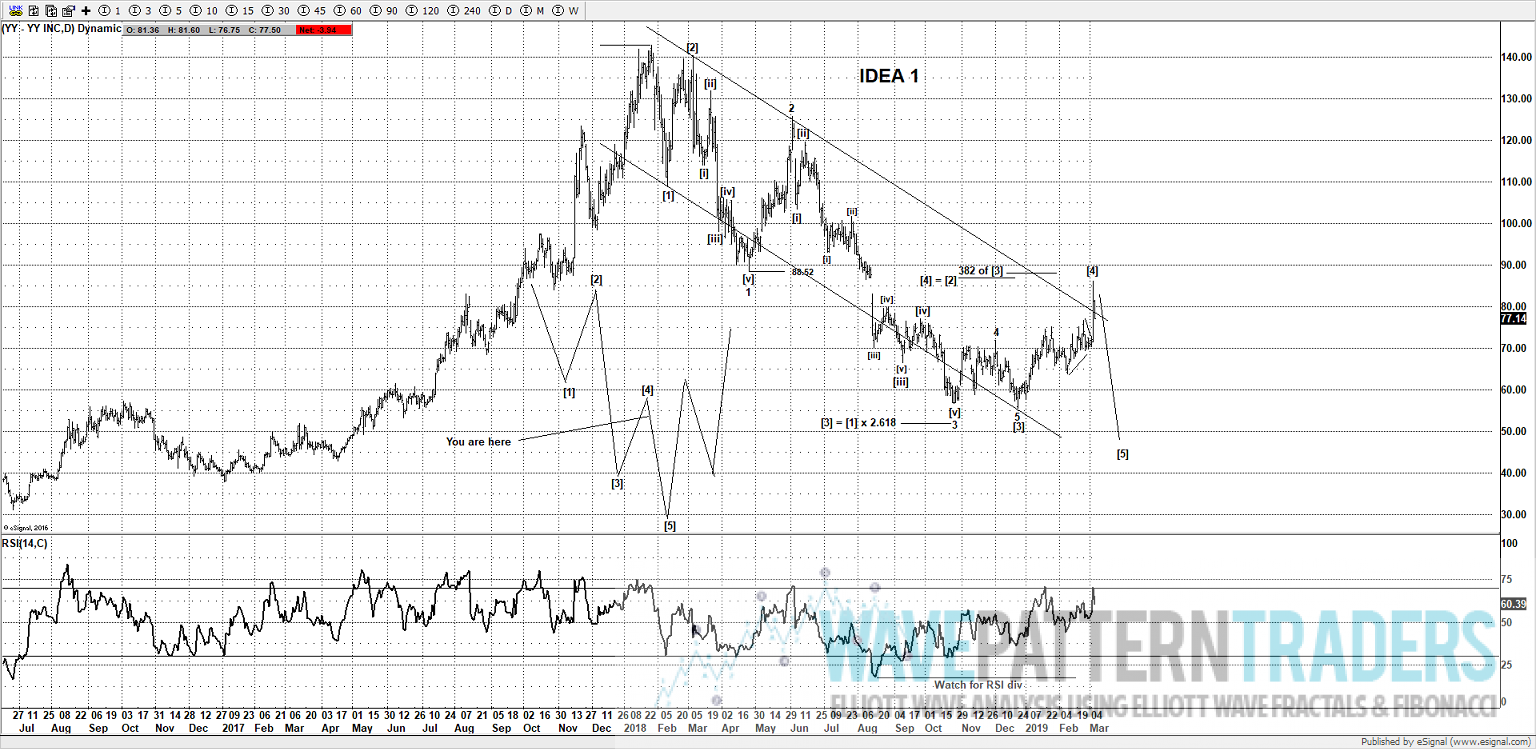
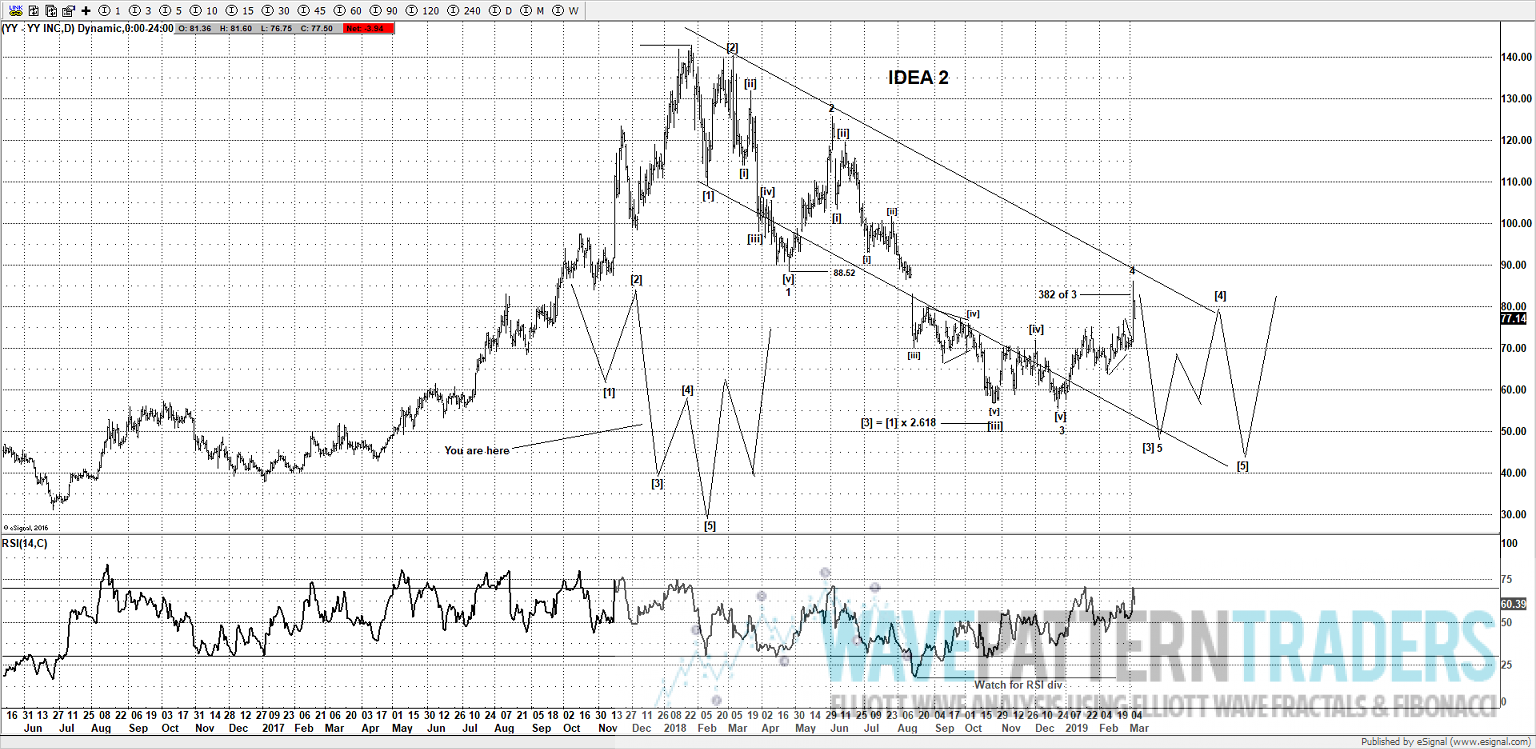
The recent rally from the lows made in December 2018 appears to be in 3 waves, so I suspected it a 4th wave as part of either idea, at this stage, I would still expect to see a new low based on both of the ideas. The difference is that one idea will end an impulse wave (5 wave decline) and complete the decline from the highs made in Jan 2018. The other idea would still see a bounce, however a new low thereafter would be favored.
I can see the pros and cons for both ideas, but I would turn more bullish from a new low as even the less bullish idea (idea 2) would imply a rally again for wave [4]. So it would present a bullish opportunity below the lows made in December around $54.00 – 49.00.
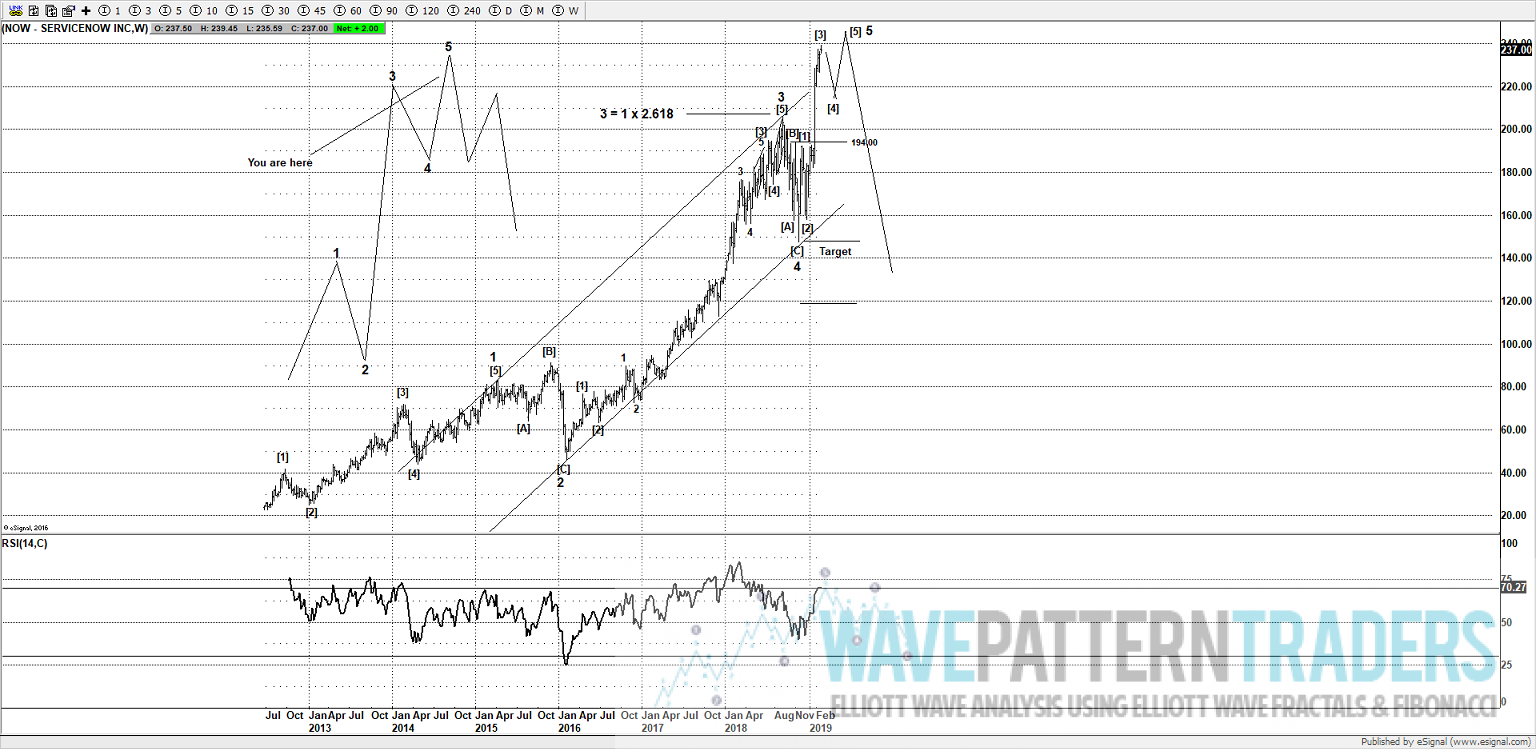
Holding below 88.52 would further support a move lower, although it needs a break back below 70.00 to argue for new lows.
Idea 1
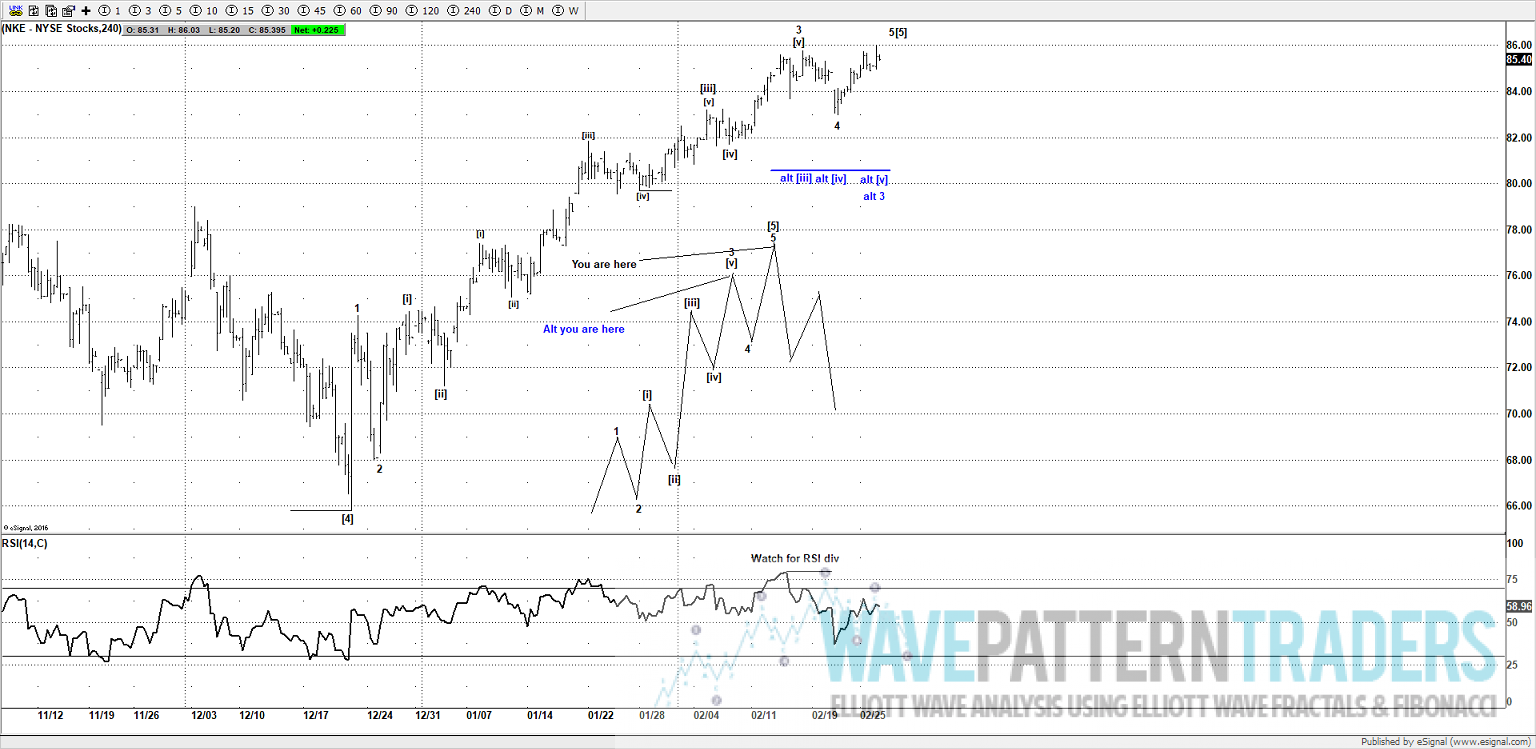
Idea 2
Do you have a stock that you want evaluating? Purchase a consultation call and get an independent review through the lens of Elliott Wave. With the US stock markets vibrating around the previous all-time highs, it may be prudent to think about protecting any gains you have.
Click here to purchase a consultation call CLICK HERE
Click here to purchase a Elliott Wave report CLICK HERE
Note: If you are a member, you can email me or send a tweet for an update if you are thinking about trading this stock.