Back in Feb 2017 I was looking for a little more upside to end wave 3 and then a pullback for wave 4, followed by new highs for wave 5. So far that has played out well, although I was looking for a slightly deeper move for wave 4, it appears wave 4 traced out as a triangle, the last few gyrations could also have completed an ending diagonal for wave 5. That is actually a bearish pattern (bearish rising wedge).
The decline from 48.91 looks impulsive, so against those highs I am now favoring further weakness.
Before
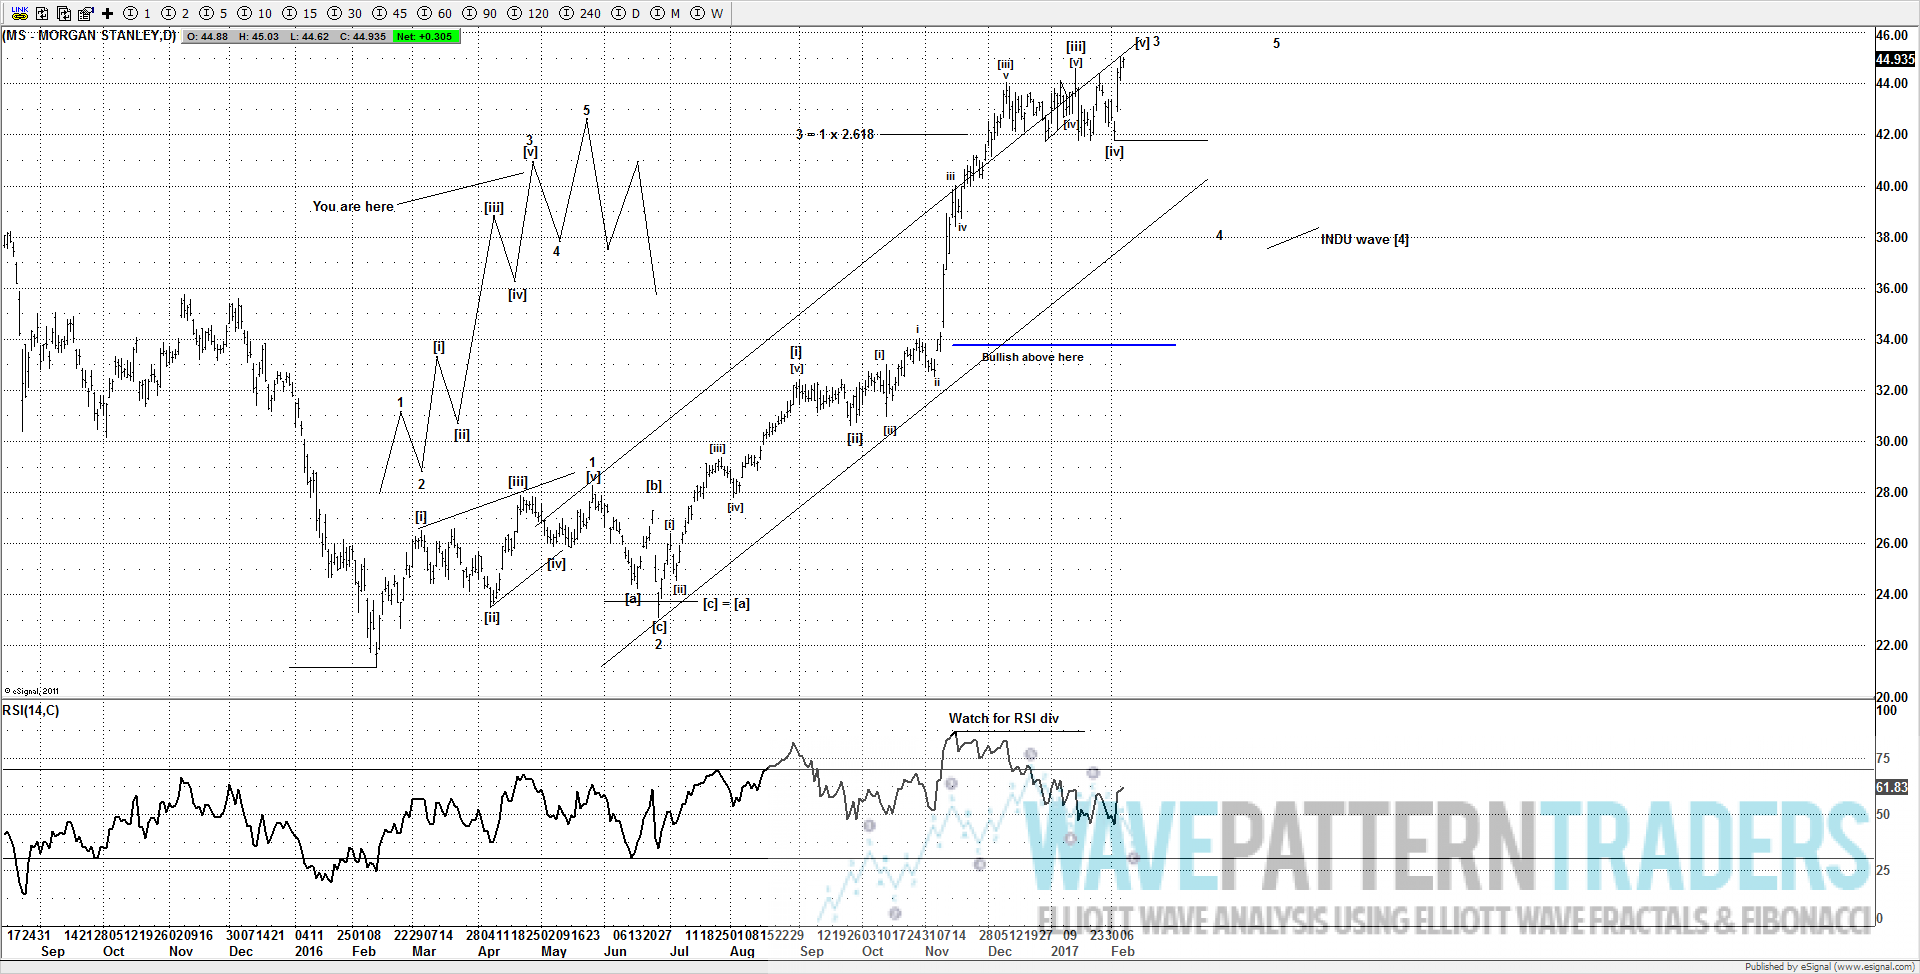
https://www.wavepatterntraders.com/elliott-wave-analysis-of-morgan-stanley-ms/
After
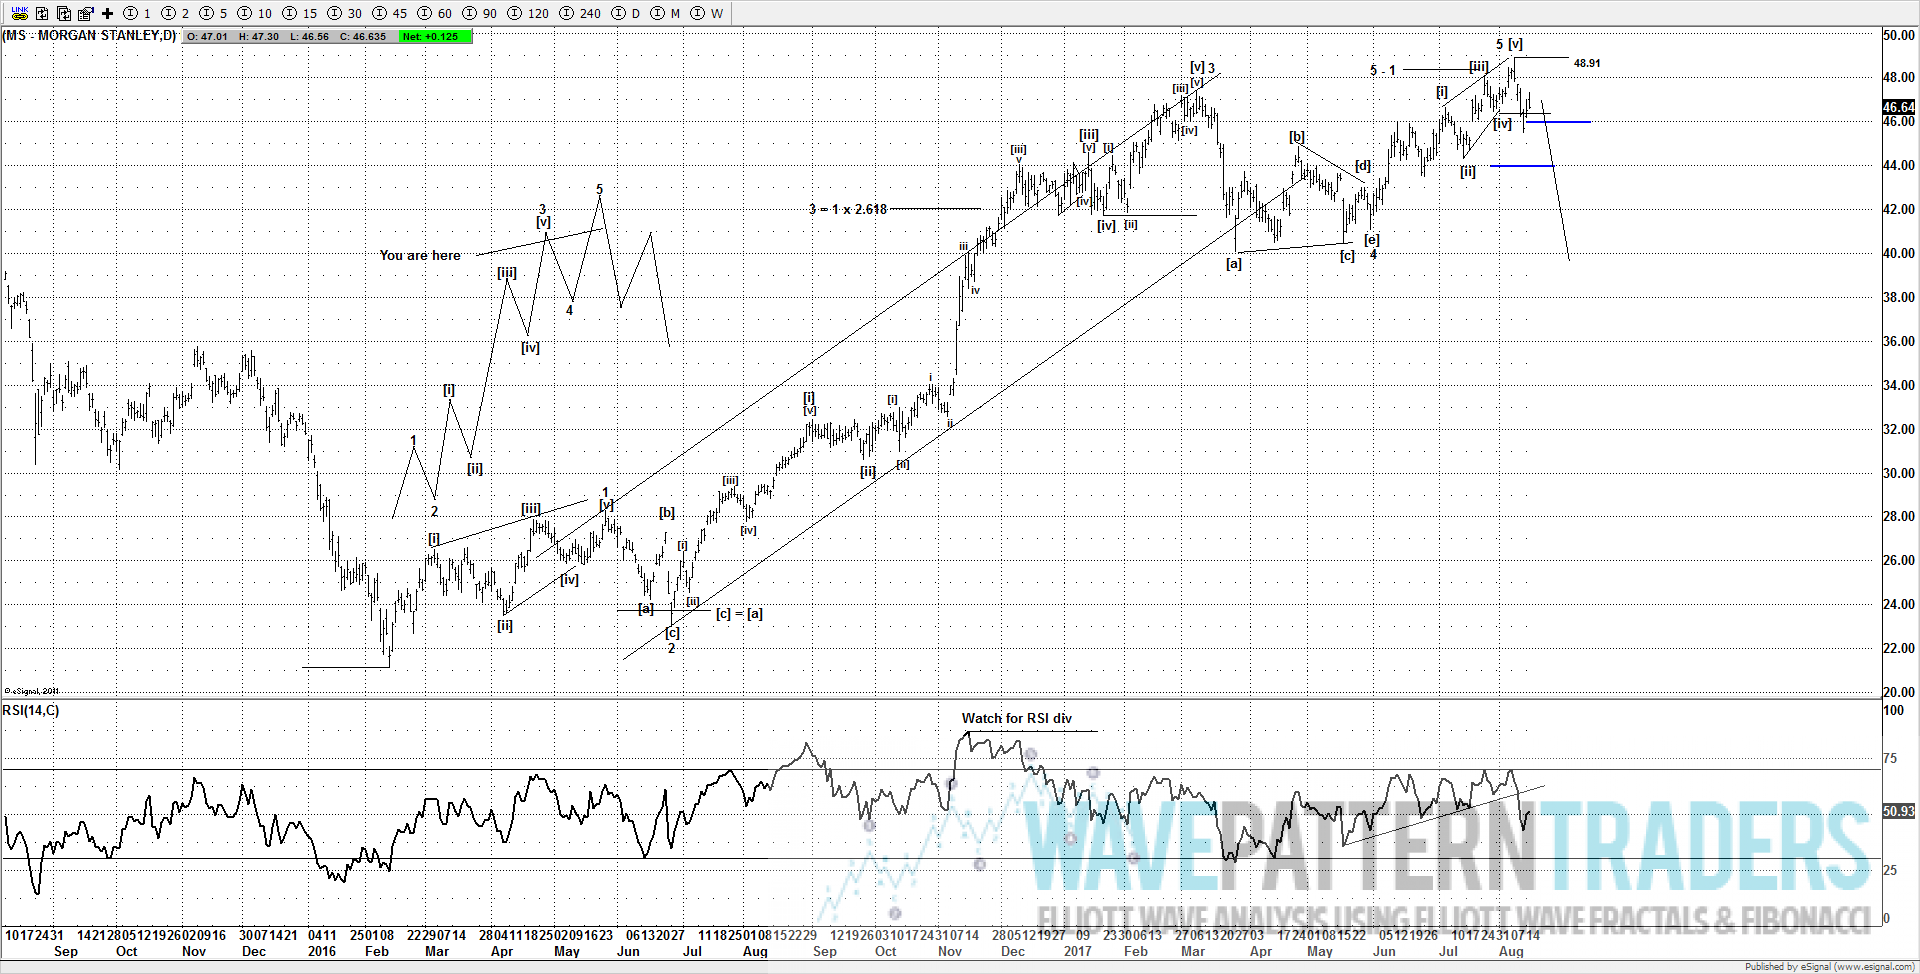
If an impulse wave from the Feb 2016 lows has actually completed at 48.91, it could be very important as the advance from the Feb 2016 lows could also have ended a much larger impulse wave from the 2008 lows and setup for a large decline. If a bounce fails to move back above 48.00 – 48.20 and then declines hard below 46.00, you may want to think about cashing out.
Do you have a stock that you want analyzing? Then why not purchase an Elliott Wave Report, it may just save you a small fortune.
CLICK HERE